Etwas zu verbessern? Schlag eine Änderung vor.
Diese Seite ist öffentlich.
In Principles of Economics 2e (OpenStax) · Seite 70 von 142
Learning Objectives
By the end of this section, you will be able to:
- Explain recessions, depressions, peaks, and troughs
- Evaluate the importance of tracking real GDP over time
When news reports indicate that “the economy grew 1.2% in the first quarter,” the reports are referring to the percentage change in real GDP. By convention, governments report GDP growth is at an annualized rate: Whatever the calculated growth in real GDP was for the quarter, we multiply it by four when it is reported as if the economy were growing at that rate for a full year.
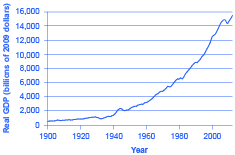
Figure 19.10. U.S. GDP, 1900–2016 Real GDP in the United States in 2016 (in 2009 dollars) was about $16.7 trillion. After adjusting to remove the effects of inflation, this represents a roughly 20-fold increase in the economy’s production of goods and services since the start of the twentieth century. (Source: bea.gov)
Figure 19.10 shows the pattern of U.S. real GDP since 1900. Short term declines have regularly interrupted the generally upward long-term path of GDP. We call a significant decline in real GDP a recession. We call an especially lengthy and deep recession a depression. The severe drop in GDP that occurred during the 1930s Great Depression is clearly visible in the figure, as is the 2008–2009 Great Recession.
Real GDP is important because it is highly correlated with other measures of economic activity, like employment and unemployment. When real GDP rises, so does employment.
The most significant human problem associated with recessions (and their larger, uglier cousins, depressions) is that a slowdown in production means that firms need to lay off or fire some of their workers. Losing a job imposes painful financial and personal costs on workers, and often on their extended families as well. In addition, even those who keep their jobs are likely to find that wage raises are scanty at best—or their employers may ask them to take pay cuts.
Table 19.7 lists the pattern of recessions and expansions in the U.S. economy since 1900. We call the highest point of the economy, before the recession begins, the peak. Conversely, the lowest point of a recession, before a recovery begins, is the trough. Thus, a recession lasts from peak to trough, and an economic upswing runs from trough to peak. We call the economy's movement from peak to trough and trough to peak the business cycle. It is intriguing to notice that the three longest trough-to-peak expansions of the twentieth century have happened since 1960. The most recent recession started in December 2007 and ended formally in June 2009. This was the most severe recession since the 1930s Great Depression. The ongoing expansion since the June 2009 trough will also be quite long, comparatively, having already reached 90 months at the end of 2016.
| Trough | Peak | Months of Contraction | Months of Expansion |
|---|---|---|---|
| December 1900 | September 1902 | 18 | 21 |
| August 1904 | May 1907 | 23 | 33 |
| June 1908 | January 1910 | 13 | 19 |
| January 1912 | January 1913 | 24 | 12 |
| December 1914 | August 1918 | 23 | 44 |
| March 1919 | January 1920 | 7 | 10 |
| July 1921 | May 1923 | 18 | 22 |
| July 1924 | October 1926 | 14 | 27 |
| November 1927 | August 1929 | 23 | 21 |
| March 1933 | May 1937 | 43 | 50 |
| June 1938 | February 1945 | 13 | 80 |
| October 1945 | November 1948 | 8 | 37 |
| October 1949 | July 1953 | 11 | 45 |
| May 1954 | August 1957 | 10 | 39 |
| April 1958 | April 1960 | 8 | 24 |
| February 1961 | December 1969 | 10 | 106 |
| November 1970 | November 1973 | 11 | 36 |
| March 1975 | January 1980 | 16 | 58 |
| July 1980 | July 1981 | 6 | 12 |
| November 1982 | July 1990 | 16 | 92 |
| March 1991 | March 2001 | 8 | 120 |
| November 2001 | December 2007 | 8 | 73 |
Table 19.7 U.S. Business Cycles since 1900 (Source: http://www.nber.org/cycles/main.html )
A private think tank, the National Bureau of Economic Research (NBER), tracks business cycles for the U.S. economy. However, the effects of a severe recession often linger after the official ending date assigned by the NBER.
Where this page came from
This page was imported from OpenStax, Principles of Economics 2e. Section 19.3 of Principles of Economics 2e by Steven A. Greenlaw, David Shapiro, published by OpenStax (Rice University) under CC BY 4.0; the book is free at openstax.org. Changed here: set as a page on its own.
Nobody has written it yet — it is the source material at a new address, which is why search engines are asked to skip it and why no one earns from it. It is up for grabs: take it on, and it is yours to rewrite and to earn from.
In diesen PublikationenPrinciples of Economics 2e (OpenStax)
Lizenz: CC BY 4.0 · Bearbeitet nach openstax.org
Kommentare