
In Valley Forge National Historical Park · page 1 of 11
The National Park Service’s Mid-Atlantic Inventory and Monitoring Network tracks a set of ecosystem “vital signs” in the region’s parks, and weather and climate are among them. This is its review of 2022 at Valley Forge National Historical Park, in Pennsylvania.
The figures are county-scale averages for Chester and Montgomery counties, which surround the park, drawn from records reaching back to 1895. The data and analysis come from the National Oceanic and Atmospheric Administration’s Climate at a Glance program.
Weather is not climate
Weather is the short-term state of the atmosphere, over minutes to months: the rain, snow or sunshine outside right now. Climate is what the long-term pattern — 30 years or more — leads one to expect. Climate is what you expect, such as a hot summer; weather is what you get, such as one warm, rainy day. The review sets 2022’s weather against that long-term climate.
A very warm year
2022 was the 15th warmest year on record in the park’s counties, and every season was warmer than normal. Ten of the twelve months ran above their long-term averages; only January and October were cooler. February and August were each more than 4 °F above normal.
| Month | Average temperature (°F) | Departure from long-term average (°F) |
|---|---|---|
| January | 28.2 | −1.2 |
| February | 35.0 | +4.2 |
| March | 43.6 | +3.8 |
| April | 51.2 | +0.7 |
| May | 63.5 | +2.5 |
| June | 70.2 | +0.6 |
| July | 77.9 | +3.4 |
| August | 76.8 | +4.4 |
| September | 67.2 | +1.5 |
| October | 53.0 | −1.2 |
| November | 46.8 | +3.6 |
| December | 34.9 | +1.8 |
| 2022 | 54.0 | +2.0 |
Departures compare each month with its average over 1895–2021.
Near-normal precipitation
Total precipitation was close to normal — the year ranked 59th wettest — but the seasons pulled in opposite directions. In the review’s seasons (winter January–March, spring April–June, summer July–September, autumn October–December), spring and autumn were wet while winter and summer were dry. April and October each brought more than 2 inches above normal; August fell almost 2 inches short.
| Month | Total precipitation (in.) | Departure from long-term average (in.) |
|---|---|---|
| January | 3.21 | −0.21 |
| February | 2.71 | −0.32 |
| March | 2.58 | −1.21 |
| April | 5.92 | +2.21 |
| May | 5.39 | +1.44 |
| June | 3.76 | −0.29 |
| July | 3.46 | −1.14 |
| August | 2.57 | −1.98 |
| September | 3.98 | −0.01 |
| October | 5.62 | +2.18 |
| November | 2.83 | −0.53 |
| December | 4.83 | +1.16 |
| 2022 | 46.87 | +1.30 |
The long-term trend
Since 1895 both measures have risen in the park’s counties: annual average temperature by about 0.2 °F per decade, and annual total precipitation by about 0.33 inches per decade.
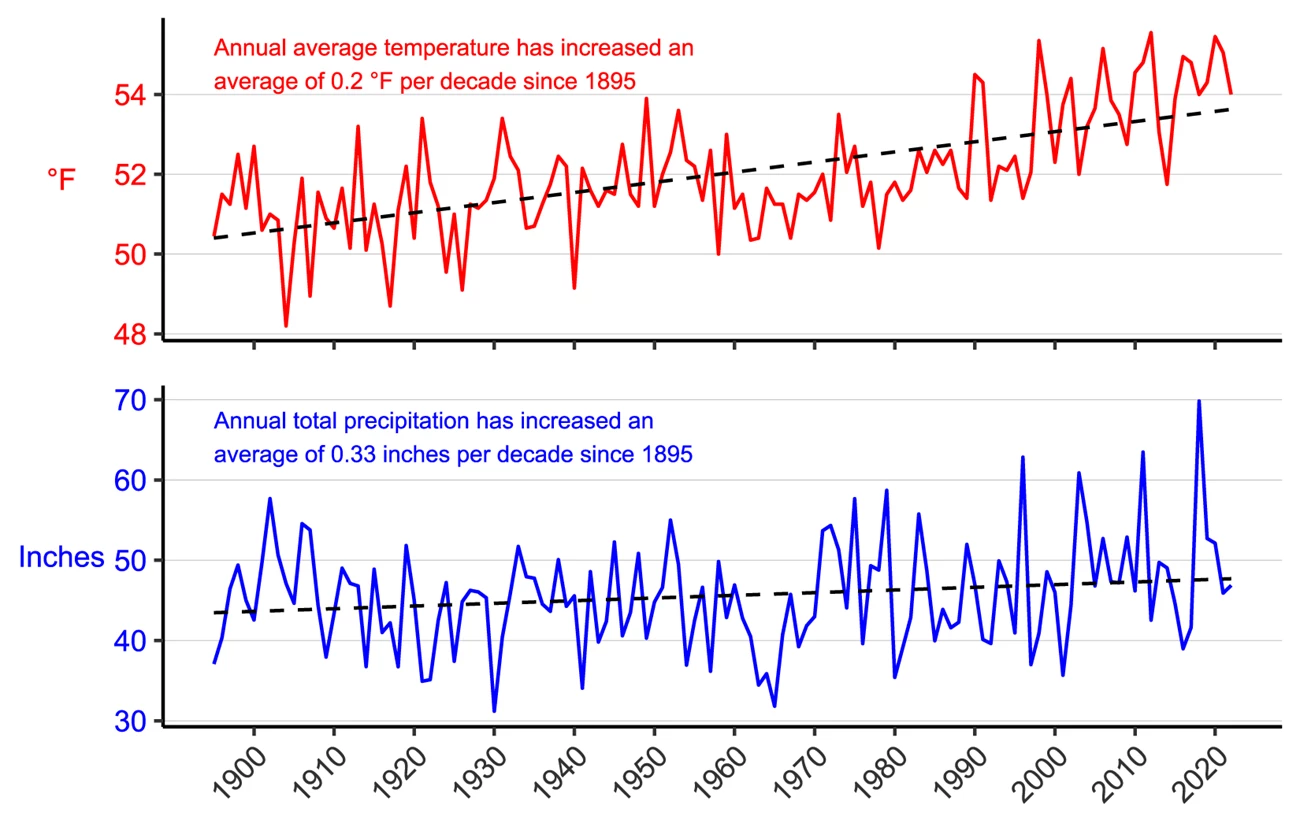
Annual average temperature (°F, top) and total precipitation (inches, bottom) for the park’s counties, 1895–2022. Dashed lines are linear estimates of change. Image from the National Park Service’s page.
Park Service scientists have also looked ahead. Climate models estimate that by 2100 the park’s annual average temperature will rise by 3.1 to 9.0 °F, from the best-case scenario to the worst, and annual precipitation by 7 to 14% (Gonzalez and others, 2018).
Rapid climate change is already testing national parks in unfamiliar ways: wildlife migrations shift, more destructive storms threaten historic resources and park facilities, and habitats are disrupted.
Sources
Based on "2022 Weather in Review: Valley Forge National Historical Park," Mid-Atlantic Inventory and Monitoring Network, National Park Service; a work of the United States government in the public domain. Data from NOAA’s NClimDiv dataset through the Climate at a Glance program. The review’s text gives the year’s precipitation as 45.8 inches; its own monthly table totals 46.87, the figure used here.
In these collectionsValley Forge National Historical Park
Licence: CC0 1.0 (public domain) · Adapted from www.nps.gov
1
0
0
0

Comments


