
Vil du gøre sidens indhold bedre? Foreslå en ændring.
Temperatures across Alaska are rising much faster than at lower latitudes. In the communities in and around Alaska's Arctic national parks, the average annual air temperature rose by more than 2.6°C from 1950 to 2021, the longest consistent record — and winters warmed most of all.
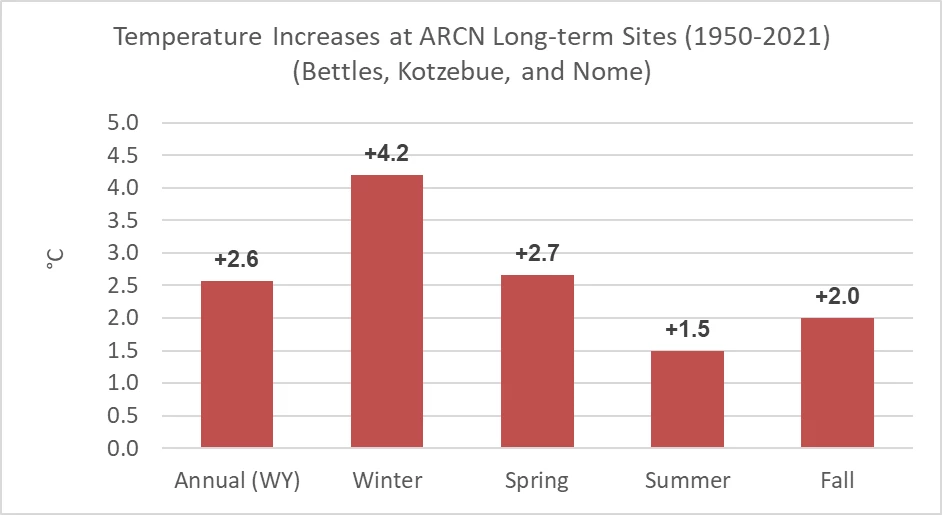
Average seasonal warming at three long-term sites near the Arctic parks, 1950–2021. The annual temperature is calculated by water year, October 1 to September 30. Credit: National Park Service.
| Season | Warming, 1950–2021 |
|---|---|
| Winter | 4.2°C |
| Spring | 2.7°C |
| Fall | 2.0°C |
| Summer | 1.5°C |
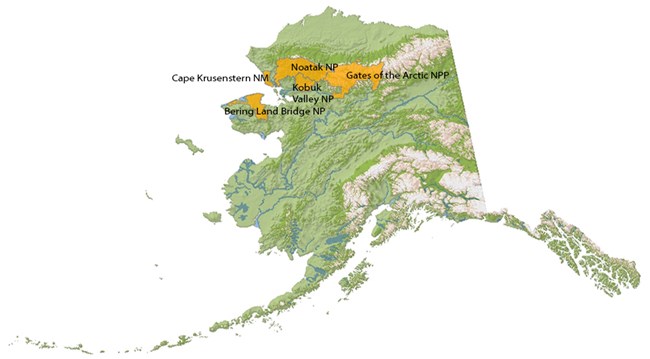
The five parks of the Arctic Network: Bering Land Bridge National Preserve, Cape Krusenstern National Monument, Noatak National Preserve, Kobuk Valley National Park, and Gates of the Arctic National Park and Preserve. Credit: National Park Service.
Warming in jumps
The rise has not been steady. Beyond ordinary year-to-year variation, the long record shows sudden shifts:
- The late 1970s. A well-documented jump in statewide temperatures matched a warm shift in sea surface temperatures.
- 2014. Another shift came with warmer ocean water and less sea ice off Alaska's west coast. Six warmer-than-normal years followed, including the warmest year on record (2019) and the second warmest (2016). Every NPS climate station in the Arctic parks recorded the 2014 shift, along with rising ground temperatures — and warmer ground means permafrost may begin to thaw, with wide-ranging effects on the landscape.
- 2020. The pattern changed again: 2020 and 2021 were much cooler than the six years before, though still within the near-normal range.
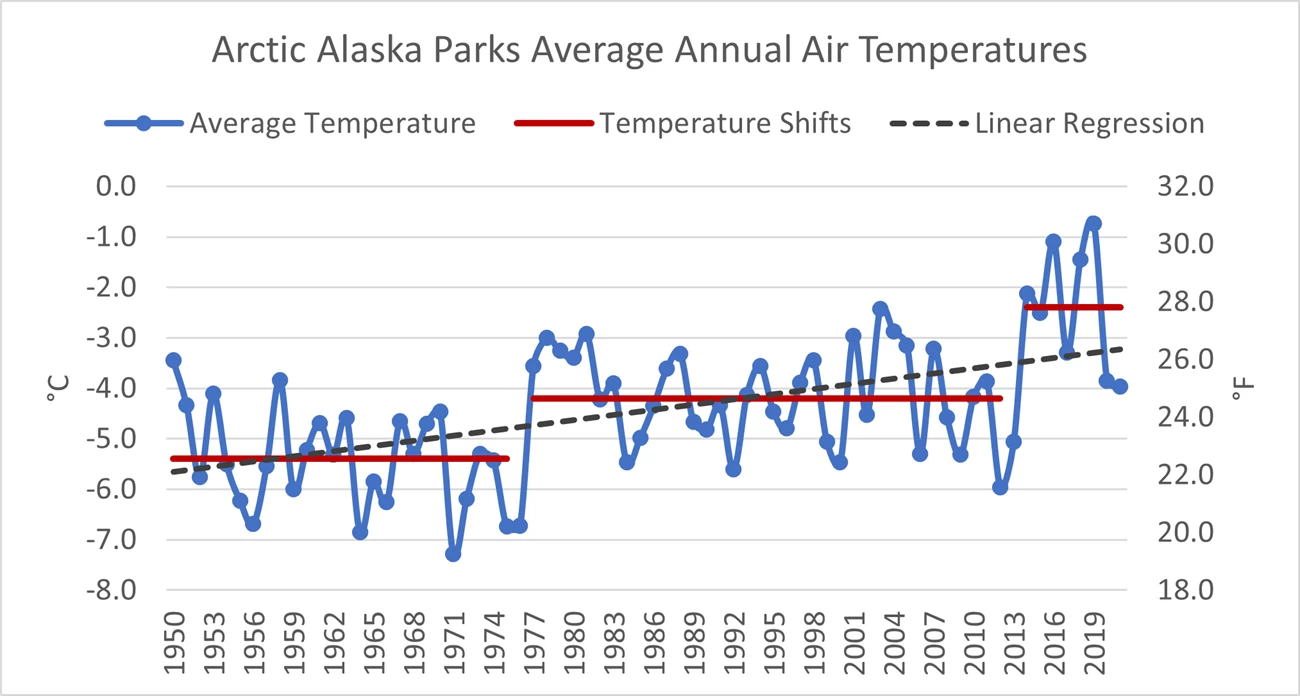
Average annual temperatures at Bettles, Kotzebue and Nome, 1950–2021. The dashed line is the trend; red lines show the average before and after the shifts of 1976 and 2014. Credit: National Park Service.
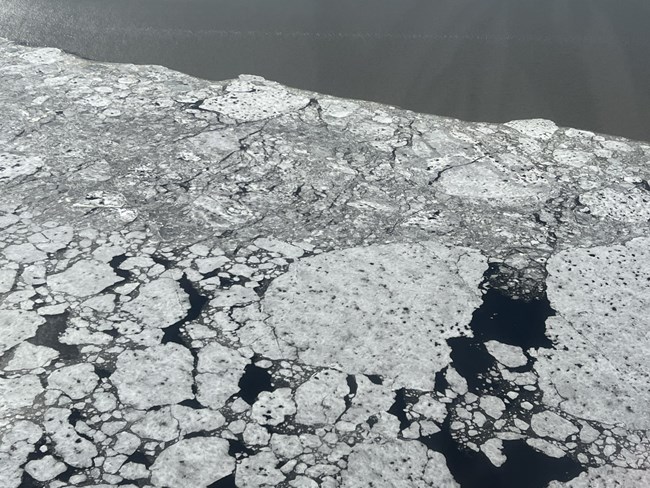
Broken sea ice. From the National Park Service.
Sea ice shapes the parks' weather. Open water supplies moisture for rain and snow, and dark water absorbs sunlight and warms nearby land. A white layer of ice reflects heat back to the atmosphere and locks moisture away.
Wetter, too
Rain and snow vary far more from place to place and year to year than temperature, but all the Arctic parks have become wetter over 70 years. Whether the increase comes as winter snow or summer rain matters ecologically.
| Station | Near | Average annual precipitation | Change since about 1950 |
|---|---|---|---|
| Bettles | Gates of the Arctic | 371 mm, 42% of it summer rain | annual total +114 mm: +76 mm in the warm season (May–September), +38 mm in the cold season (October–April), both significant, the warm-season trend stronger |
| Kotzebue | the northwestern parks | relatively low; June–August bring more than half | annual total +105 mm, almost all in the cold season (+96 mm, significant); the warm season only +8 mm, with no trend |
| Nome | the northwestern parks | 415 mm, about 60% from May to September; August wettest | wetter in the cold season, with significant increases in October, December and February; no trend in the warm season |
The cold-season total is a good guide to the winter snowpack.
Why it matters
Climate is the most important broad-scale influence on ecosystems, and global climate models show change and variability will be greatest at high latitudes. In the Arctic parks, likely effects include a smaller snowpack, earlier ice break-up on lakes, warmer winters and wetter summers, which may change where plants and animals live, how many there are, and how well they grow. Across Alaska's parks, a warming climate can mean melting glaciers and permafrost, more frequent fires, and changing vegetation.
How the parks measure it
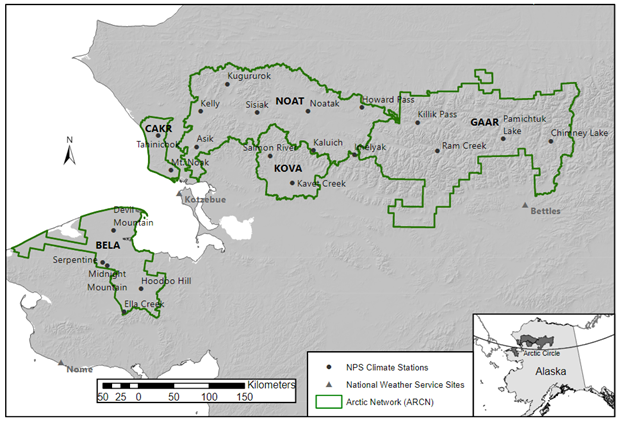
Arctic Network climate stations in the five parks. Credit: National Park Service.
The parks have 21 climate stations — 17 Arctic Network Remote Automated Weather Stations, 3 fire weather stations and 1 SNOTEL station — recording temperature, summer rainfall, wind speed and direction, soil temperature, relative humidity and solar radiation. Snow depth is measured at some sheltered sites; many stations stand in exposed, windy places where snow is hard to measure. With the stations in Nome, Kotzebue and Bettles, these rare high-latitude stations track long- and short-term trends, supply data to other researchers, and feed monitoring and modeling beyond the parks.
Sources
Based on "Weather and Climate Resource Brief for the Arctic Network," National Park Service Arctic Inventory and Monitoring Network, a work of the United States government in the public domain. See also D. K. Swanson, P. J. Sousanes and K. Hill, "Increased Mean Annual Temperatures in 2014–2019 Indicate Permafrost Thaw in Alaskan National Parks," Arctic, Antarctic, and Alpine Research 53 (2021).
I disse samlingerBering Land Bridge National PreserveNoatak National PreserveGates Of The Arctic National Park & PreserveCape Krusenstern National MonumentKobuk Valley National Park
Licens: CC0 1.0 (offentligt eje) · Bearbejdet efter www.nps.gov
1
0
0
0

Kommentarer


