
Ser du noget at forbedre? Foreslå en ændring.
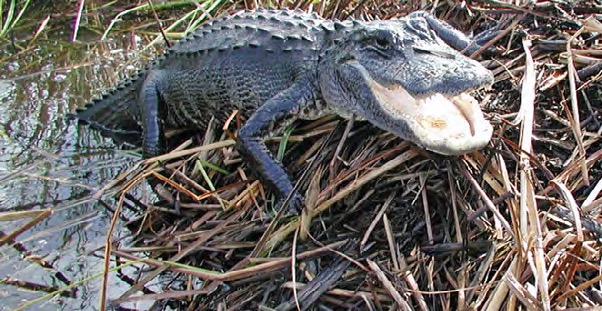
An alligator on its nest in Everglades National Park. NPS / Lori Oberhofner, 2005.
A vast wetland under repair
The Everglades is a huge (about 47,000 square kilometers), unique subtropical wetland in central and south Florida. It shelters many endemic and endangered species, guards against flooding, and supplies much of south Florida's water.
In 2000, Congress passed the Water Resources Development Act of 2000 (Public Law 106–541), authorizing the Comprehensive Everglades Restoration Plan (CERP) to improve the timing, distribution and quality of water flowing through the Everglades so its original habitats can recover. It is one of the largest and most expensive ecological restorations in the world, and it depends on wide cooperation among stakeholders.
Why models need a common frame
Decision makers must balance stakeholders' needs and choose among competing restoration plans. Ecological models help judge each plan's likely effects, but there are many separate models, and each may or may not capture the system's variability. Their outputs have to be weighed against each model's assumptions and uncertainty. A common modeling framework, with standard outputs and measures of uncertainty, would make decisions faster and more open.
What the EVA is
The Everglades vulnerability analysis (EVA) is led by the U.S. Geological Survey with the National Park Service and the U.S. Army Corps of Engineers. It meets a science goal of Restoration Coordination & Verification (RECOVER), the multiagency group that evaluates how well CERP restores, preserves and protects south Florida's ecosystem while meeting the region's other water needs. In 2016, RECOVER called for a tool to pull together decades of Everglades science and pinpoint areas vulnerable to changing conditions.
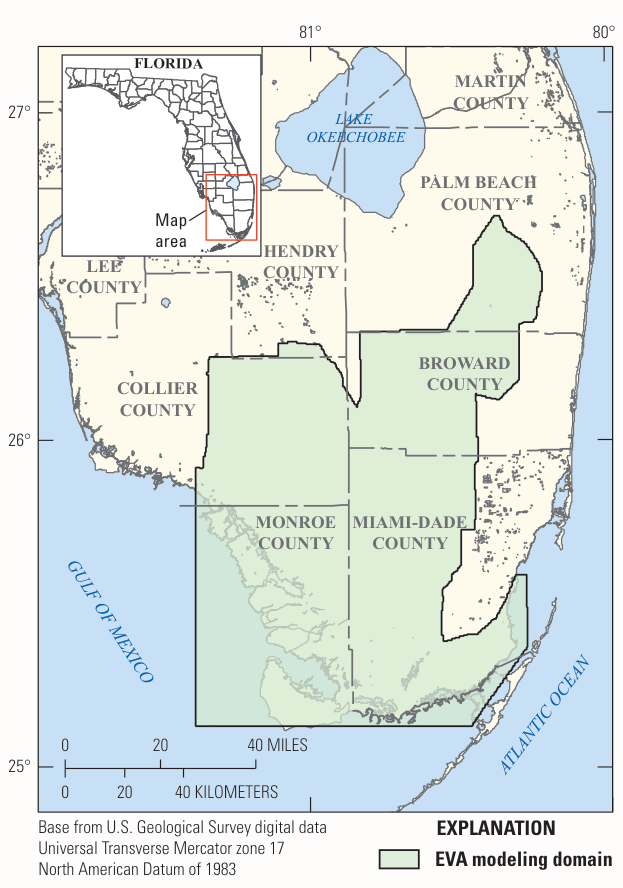
The EVA's modeling area in south Florida, 2021. U.S. Geological Survey.
The EVA answers with a landscape-scale framework giving yearly responses and relative vulnerability for a set of ecosystem-health indicators — "vulnerability" meaning how far an indicator drifts from an ideal state that the tool's users define. It shows how predictions vary across the landscape, accounts for that variability explicitly, and can test restoration alternatives against long-term changes such as sea-level rise.
How it works
The EVA tracks four indicators:
- sawgrass peat — its subsidence and accretion;
- vegetation patterns across the landscape;
- how suitable the land is for nesting American alligators;
- the size and location of wading bird nesting colonies.
Each indicator is a spatially explicit Bayesian network, linked with the others. Scientists first drew influence diagrams of how each part of the system works, then turned them into networks that take hydrologic and landscape data and, through probability tables, produce categorical outcomes — which is how the networks carry uncertainty.
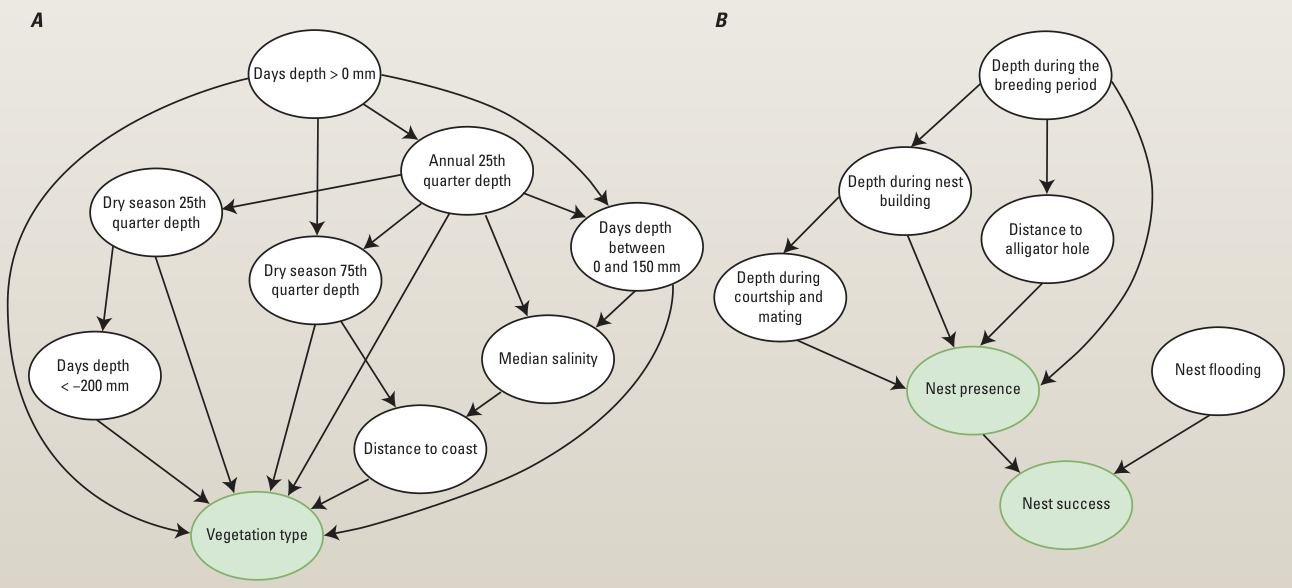
Influence diagrams for vegetation type (A) and alligator nest presence (B). White circles are hydrologic or landscape variables. U.S. Geological Survey.
- Inputs: the EVA can take outputs from several hydrological models — the Everglades Depth Estimation Network, the Biscayne and Southern Everglades Coastal Transport model, or the Regional Simulation Model.
- Output: each indicator's result is compared with the user's ideal; through ordination, its distance from that ideal is measured, and places farther away count as more vulnerable.
- Use: managers can compare restoration projects on the resulting vulnerability surface, and test sea-level rise by adjusting the networks' inputs to possible future climates.
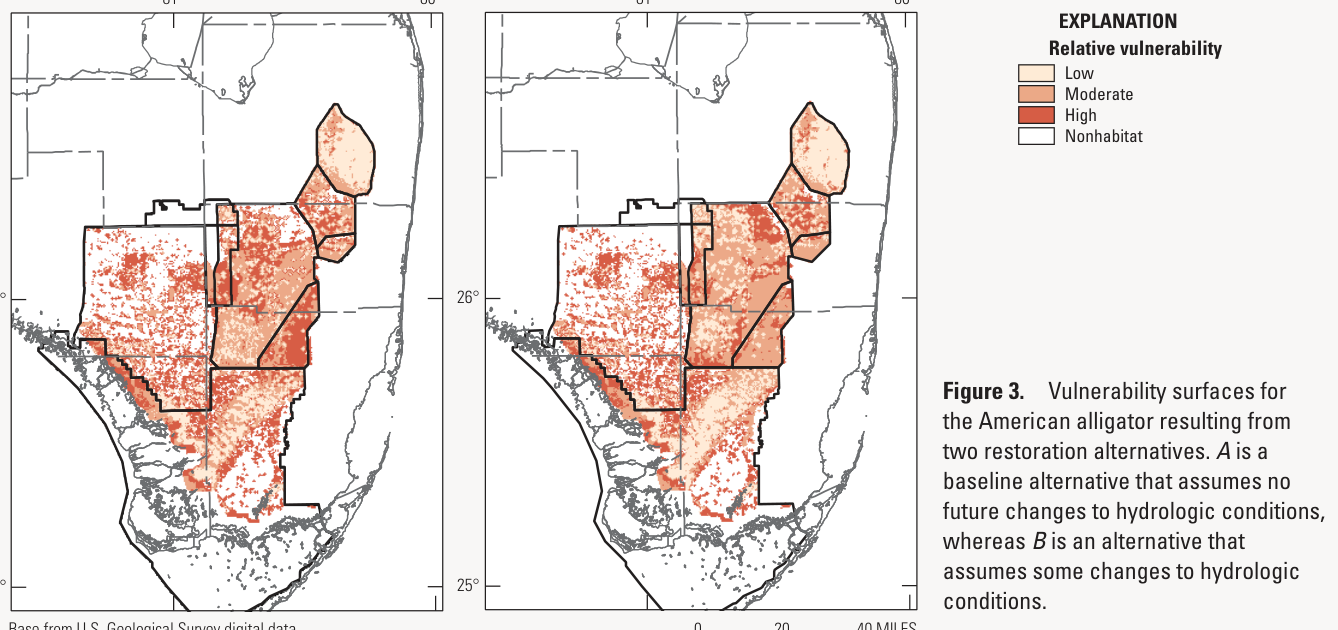
Alligator vulnerability under two restoration alternatives: a baseline with no future change in hydrology (A) and one with some change (B). U.S. Geological Survey.
Many kinds of data
The networks can draw on data of any source and format. Vegetation, alligator nesting and wading bird colony networks come from long-term monitoring; the peat network uses mesocosm experiments on the Everglades coast; future networks may rest on expert opinion. Together, decades of research feed one decision tool.
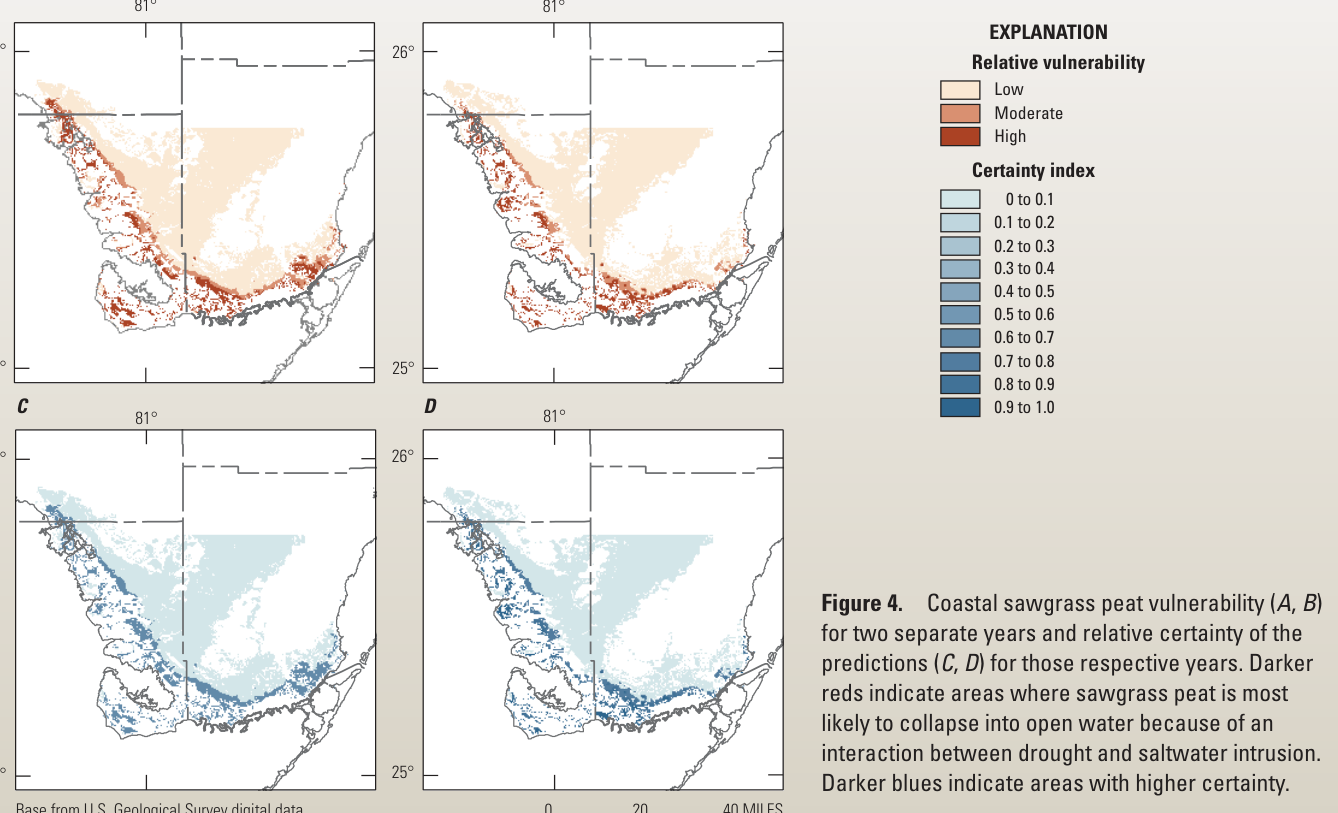
Coastal sawgrass peat vulnerability in two years (A, B) and how certain each prediction is (C, D). Darker reds mark peat most likely to collapse into open water as drought and saltwater intrusion combine; darker blues, higher certainty. U.S. Geological Survey.
Next
The EVA now covers vegetation, soil elevation and wildlife. Other climate effects — changing rainfall or severe weather — could be added easily, and so could networks for economic and social indicators.
Sources
Based on The Everglades Vulnerability Analysis—Integrating Ecological Models and Addressing Uncertainty, U.S. Geological Survey Fact Sheet 2021–3033, by Laura E. D’Acunto, Stephanie S. Romañach, Saira M. Haider, Caitlin E. Hackett, Jennifer H. Nestler, Dilip Shinde and Leonard G. Pearlstine, prepared with the National Park Service and U.S. Army Corps of Engineers, USGS Publications Warehouse; a work of the United States government in the public domain. Photograph and figures recovered from the fact sheet's PDF.
Licens: CC0 1.0 (offentligt eje) · Bearbejdet efter pubs.usgs.gov
1
0
0
0

Kommentarer


