Etwas zu verbessern? Schlag eine Änderung vor.
The ocean’s ability to store and release heat over long periods of time gives it a central role in stabilizing Earth’s climate system. But when the ocean absorbs more heat than it releases, its heat content increases. Warming causes water to expand, raising global sea level. Higher water temperatures can also threaten marine ecosystems, disrupting fisheries and the people who depend upon them.
Conditions in 2012

Heat energy stored in the top 2,300 feet (700 meters) of the ocean in 2012 compared to the 1993-2012 average. Orange and blue areas show where the upper ocean’s heat storage rose or fell by as much as 4 gigajoules per square meter — that’s enough energy in one square meter alone to power a 100-watt light bulb continuously for nearly a year. NOAA map by Dan Pisut, Environmental Visualization Lab, based on heat content data from the National Oceanographic Data Center.
Heat content in the upper 2,300 feet, or a little less than one-half mile, of the ocean remained near record high levels in 2012. The upper ocean held more heat than average in most of the major ocean basins visible on the map above, with the exception of the Pacific Ocean. A short-lived La Niña in early 2012 left a mark of slightly cooler upper ocean temperatures in the eastern Pacific and western Indian oceans. This was mirrored by warm temperatures in the western tropical Pacific and eastern tropical Indian Ocean.
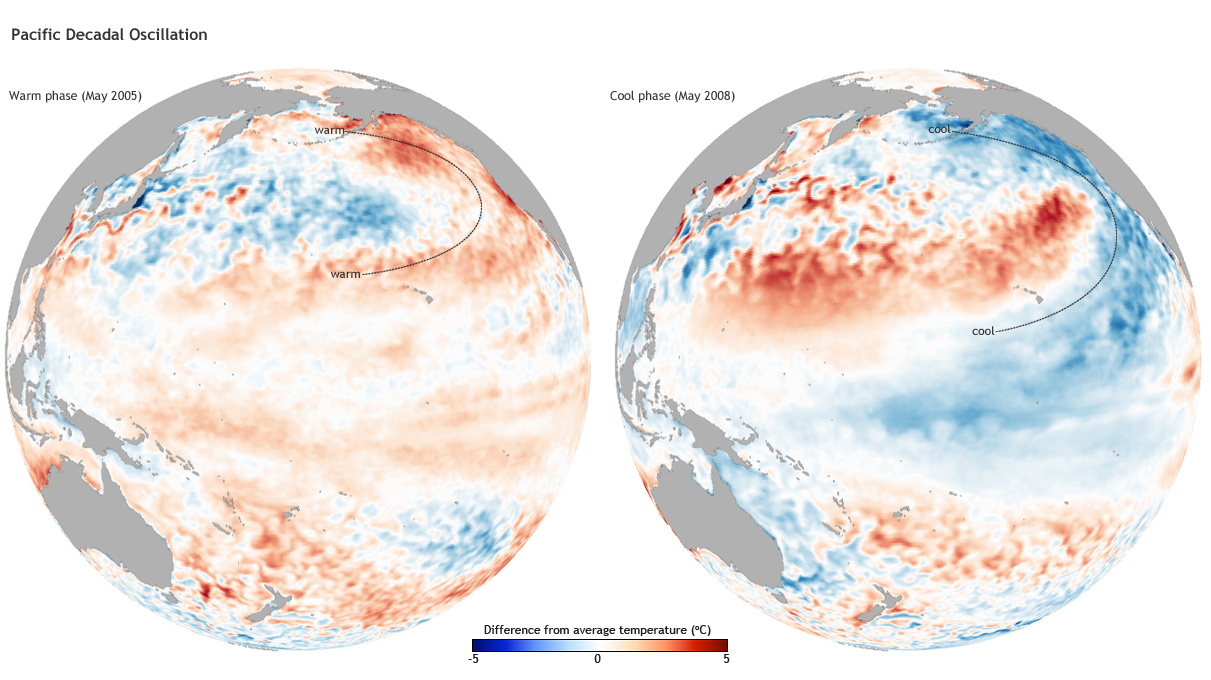
The Pacific Ocean also experienced a cool phase of the Pacific Decadal Oscillation (PDO) pattern in 2012. The tell-tale “signal” of a negative PDO phase is a horseshoe-shaped area of cool water in the eastern North Pacific that surrounds a pocket of warm water in the central North Pacific.
Change Over Time
Increasing concentrations of greenhouse gases are preventing heat from escaping into space as freely as it used to, and most of the excess heat is being stored in the upper ocean. As a result, upper ocean heat content anomalies have continued to increase significantly over the past two decades, although at a slower rate since 2003.

The graph shows an analysis of ocean heat content anomalies since 1993 from the National Oceanographic Data Center (Levitus et al, 2012). Graph adapted from Figure 3.7 in the BAMS’ State of the Climate in 2012.
Reference
G. C. Johnson, J. M. Lyman, J. K. Willis, S. Levitus, T. Boyer, J. Antonov, S. A. Good, C. M. Domingues, S. Wijffels, and N. Bindoff, 2013: [Global Oceans] Ocean Heat Content [in “State of the Climate in 2012”]. Bulletin of the American Meteorological Society (BAMS), S50-S53.
Related Links
State of the Climate: 2011 Ocean Heat Content
Climate Change: Ocean Heat Content
Where this page came from
This page was imported from NOAA Climate.gov. Published by NOAA Climate.gov, which lets anything credited to it be re-used with attribution; material credited to others is left out.
Nobody has written it yet — it is the source material at a new address, which is why search engines are asked to skip it and why no one earns from it. It is up for grabs: take it on, and it is yours to rewrite and to earn from.
Lizenz: CC0 1.0 (gemeinfrei) · Bearbeitet nach www.climate.gov
1
0
0
0

Kommentare