
Willst du den Inhalt der Seite besser machen? Schlag eine Änderung vor.

New River Gorge Grandview North Overlook with rhododendron blooming NPS photo
In order to better understand ecosystem health in national parks, the Eastern Rivers and Mountains Network measures ecosystem "vital signs" in select national parks in West Virginia, Pennsylvania, New Jersey, and New York. One of those vital signs is weather and climate. Below is a summary of 2022 weather conditions at New River Gorge National Park and Preserve.
This brief provides county-scale weather data averaged from all of the counties surrounding the park, including data from 1895–2022 (i.e., period of record). These counties include Fayette, Raleigh, and Summers counties, West Virginia. Data and analyses herein are courtesy of the National Oceanic and Atmospheric Administration's (NOAA) Climate at a Glance Program.
Weather vs. Climate
First of all, what is the difference between weather and climate? Weather consists of the short-term (minutes to months) changes in the atmosphere. Weather is what is happening outside at this very moment, be it rain, snow, or just a warm sunny day. Climate is what you expect to see based on long-term patterns of over 30 years or more. An easy way to remember the difference is that climate is what you might expect, like a hot summer, and weather is what you get, like a warm rainy day.
The following information includes a discussion of 2022 weather placed in the context of long-term climate (i.e., how did 2022 compare to a "normal" year?).
2022 Summary
In all, 2022 was slighly warmer and much wetter than average for Fayette, Raleigh, and Summers counties, West Virginia. The year ended as the 44th warmest and 19th wettest on record (since 1895). Data indicate that over the long term, annual average temperature and annual total precipitation have both increased (+0.04 °F per decade and +0.07 inches per decade, respectively).
Temperature
In total, 2022 was the 44th warmest year recorded at the park with all seasons having temperatures near normal or just above normal (Figure 1). Feburary, March, May, and November were particularly warm (i.e., more than 2 °F above long-term averages), but January and October were abnormally cold (3.5 °F and 3.6 °F below long-term averages, respectively; Table 1).

Figure 1. Seasonal and annual temperature rankings park counties. An arrow at the top of the figure would represent the warmest year/season on record (since 1895); at the bottom, the coldest year/season on record. Winter = Jan–Mar, Spring = Apr–June, Summer = July–Sept, Autumn = Oct–Dec.
Table 1. Monthly and annual average temperature and departure from long-term averages. Departures from average show how different 2022 was compared to relevant averages from 1895-2021.
| Month/Year | Average temperature (°F) | Departure from
long-term average (°F) |
| --- | --- | --- |
| January | 28.0 | −3.5 |
| February | 36.6 | +2.9 |
| March | 45.7 | +3.7 |
| April | 51.8 | +0.1 |
| May | 62.9 | +2.2 |
| June | 67.8 | 0.0 |
| July | 72.2 | +0.9 |
| August | 71.1 | +0.8 |
| September | 63.3 | −1.2 |
| October | 50.1 | −3.6 |
| November | 45.0 | +2.2 |
| December | 34.9 | +0.9 |
| 2022 | 52.5 | +0.5 |
Precipitation
It was a very wet year for counties surrounding the park, with summer being particularly above normal for precipitation. The year ranked as the 19th wettest on record (Figure 2). In total, 50.94 inches of precipitation fell, 6.6 inches more than the long-term average (Table 2).
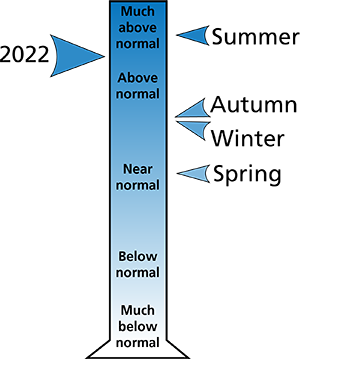
Figure 2. Seasonal and annual precipitation rankings for park counties. An arrow at the top of the figure would represent the wettest year/season on record (since 1895); at the bottom, the driest year/season on record. Winter = Jan–Mar, Spring = Apr–June, Summer = July–Sept, Autumn = Oct–Dec.
Table 2. Monthly and annual total precipitation and departure from long-term averages. Departures from average show how different 2022 was compared to relevant averages from 1895-2021.
| Month/Year | Total precipitation (in.) | Departure from
long-term average (in.) |
| --- | --- | --- |
| January | 5.47 | +1.93 |
| February | 3.99 | +0.76 |
| March | 2.33 | −1.74 |
| April | 2.92 | −0.78 |
| May | 5.51 | +1.32 |
| June | 4.07 | −0.26 |
| July | 7.63 | +2.77 |
| August | 5.63 | +1.55 |
| September | 2.88 | −0.27 |
| October | 4.02 | +1.12 |
| November | 3.52 | +0.61 |
| December | 2.96 | −0.40 |
| 2022 | 50.94 | +6.60 |
Temperature and Precipitation Trends
(1895-2022)
Data for Fayette, Raleigh, and Summers counties, WV indicate that annual average temperature has increased approximately 0.04 °F per decade and annual total precipitation has increased approximately 0.07 inches per decade since 1895 (Figure 3).
National Park Service scientists have forecast future changes in climate too. Models estimate that by 2100, annual average temperature at the park will increase by 2.9–8.6 °F (from a best-case to worst-case scenario, respectively). Annual total precipitation is expected to increase by 6–11% (see Gonzalez et al., 2018 for details).

Figure 3. Annual average temperature (°F) and annual total precipitation (in.) from 1895–2022 for Fayette, Raleigh, and Summers counties, WV. Dashed lines represent linear estimates of change.
Climate Change
Today's rapid climate change challenges national parks in ways we've never seen before. Wildlife migrations are altered, increasingly destructive storms threaten cultural resources and park facilities, habitat is disrupted—the list goes on. To read about the effects of climate change at New River Gorge National Park and Preserve, visit the park's climate change website.
For more information, contact Mid-Atlantic Network Biologist, Jeb Wofford or Eastern Rivers and Mountains Network Program Manager, Matt Marshall. Data included in this article were obtained from NOAA's NClimDiv dataset (version v1.0.0-20230106).
Where this belongs
- New River Gorge National Park & Preserve
Where this page came from
This page was imported from National Park Service. Produced by the U.S. National Park Service and, as a work of the United States government, in the public domain.
Nobody has written it yet — it is the source material at a new address, which is why search engines are asked to skip it and why no one earns from it. It is up for grabs: take it on, and it is yours to rewrite and to earn from.
In diesen SammlungenNew River Gorge National Park & Preserve
Lizenz: CC0 1.0 (gemeinfrei) · Bearbeitet nach www.nps.gov
1
0
0
0

Kommentare
Weiterlesen


