
Willst du den Inhalt der Seite besser machen? Schlag eine Änderung vor.
2022 was the 16th-warmest year on record at Hopewell Furnace National Historic Site in southeastern Pennsylvania, and every one of its four seasons ran warmer than normal. Rainfall told a different story: 46.03 inches fell over the year, only 0.69 inches above the long-term average — but it arrived unevenly, with a wet spring and autumn on either side of a dry summer.
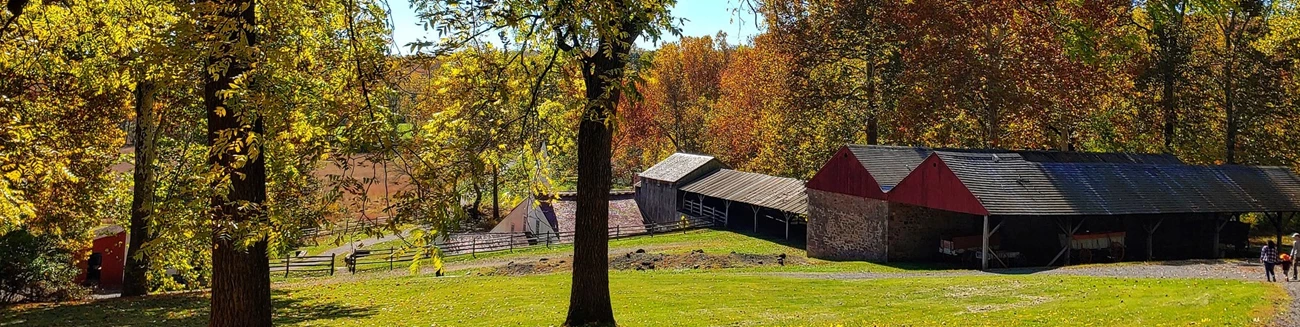
NPS photo.
The figures come from the National Park Service's Mid-Atlantic Inventory and Monitoring Network, which tracks weather and climate as one of the "vital signs" of park ecosystems. They are county-scale averages for Berks and Chester counties from NOAA's Climate at a Glance program, with a record going back to 1895.
Weather is one year; climate is thirty
The network is careful about the difference. Weather is the short-term state of the atmosphere, from minutes to months — the warm rainy day. Climate is what the long-term pattern of 30 years or more leads you to expect — the hot summer. So the useful question about 2022 is not "was it warm?" but "how did it compare with a normal year?"
Temperature: ten warm months out of twelve
The year averaged 53.2 °F, 1.8 °F above the long-term average. Ten months were warmer than normal; February (+4.0 °F), March (+3.6 °F) and August (+4.2 °F) each ran more than 3.5 °F above average. Only January and October came in cool.
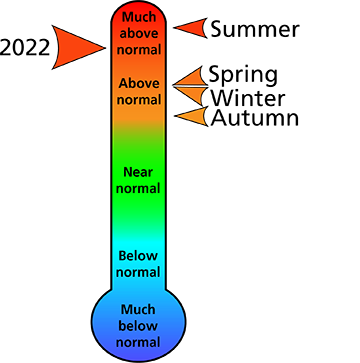
Seasonal and annual temperature rankings for the park's counties since 1895. Winter is January–March, spring April–June, summer July–September, autumn October–December.
| Month | Average (°F) | Departure (°F) |
|---|---|---|
| January | 27.4 | −1.2 |
| February | 34.1 | +4.0 |
| March | 42.8 | +3.6 |
| April | 50.2 | +0.2 |
| May | 63.2 | +2.6 |
| June | 69.6 | +0.4 |
| July | 76.8 | +3.0 |
| August | 76.0 | +4.2 |
| September | 66.4 | +1.4 |
| October | 52.1 | −1.5 |
| November | 46.0 | +3.4 |
| December | 34.1 | +1.8 |
| 2022 | 53.2 | +1.8 |
Departures are from the 1895–2021 average.
Rain: a normal total, badly timed
The annual total ranked only 57th wettest, yet the months swung widely. April (+1.70 in.), May (+1.59 in.) and October (+1.64 in.) were wet; August was the driest month against its norm, 2.16 inches short.
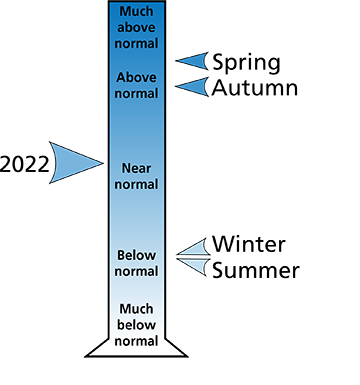
Seasonal and annual precipitation rankings for the park's counties since 1895.
| Month | Total (in.) | Departure (in.) |
|---|---|---|
| January | 2.82 | −0.55 |
| February | 3.06 | +0.09 |
| March | 2.72 | −1.00 |
| April | 5.41 | +1.70 |
| May | 5.55 | +1.59 |
| June | 3.83 | −0.30 |
| July | 3.76 | −0.77 |
| August | 2.33 | −2.16 |
| September | 4.02 | −0.02 |
| October | 5.12 | +1.64 |
| November | 2.66 | −0.69 |
| December | 4.74 | +1.16 |
| 2022 | 46.03 | +0.69 |
The longer trend, and what comes next
Across 1895–2022, annual average temperature in the two counties has risen about 0.2 °F per decade and annual precipitation about 0.38 inches per decade. NPS scientists project that by 2100 the park's annual average temperature will rise by 3.1–9.0 °F, from the best-case to the worst-case scenario, with annual precipitation up 7–14% (Gonzalez et al., 2018).
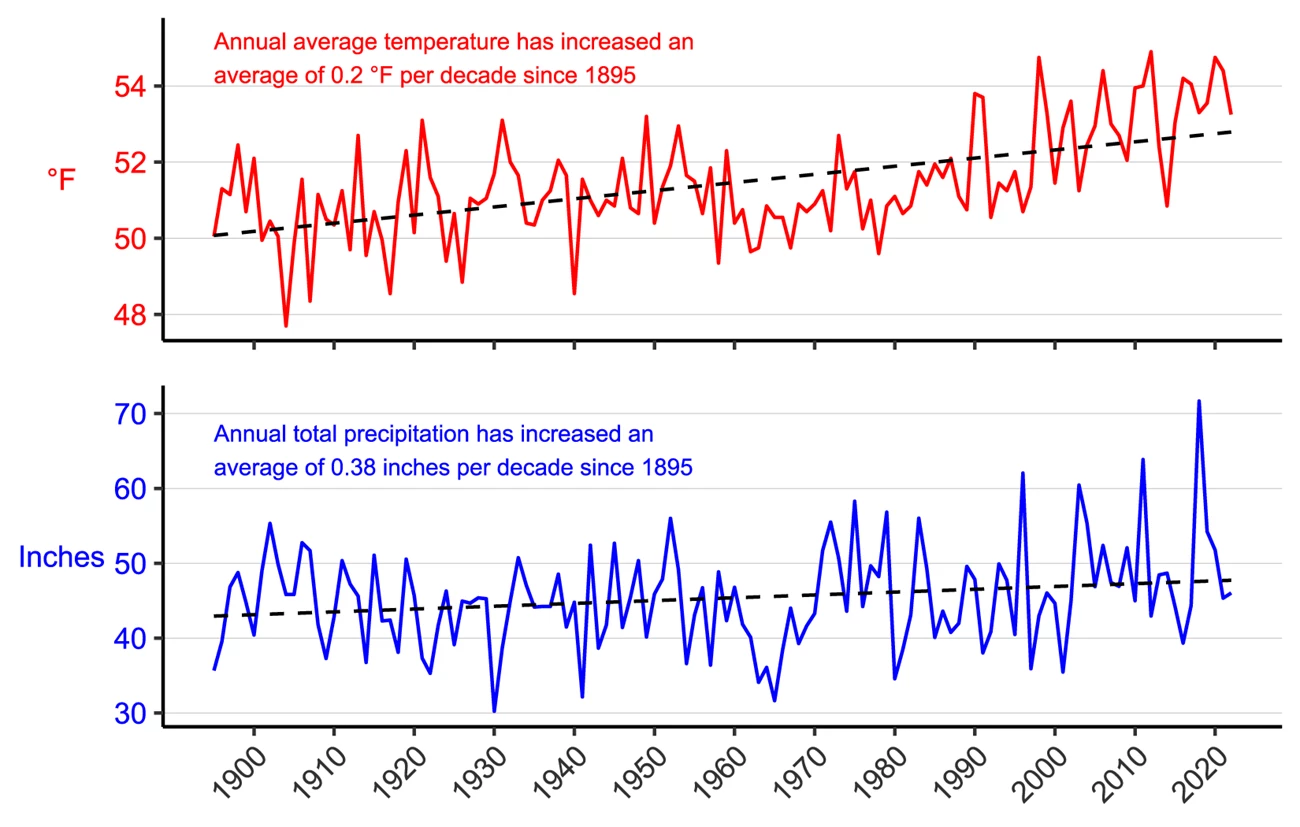
Annual average temperature and total precipitation for Berks and Chester counties, 1895–2022. Dashed lines are linear estimates of change.
A warmer, wetter park with more erratic rainfall is the setting the National Park Service is planning for: altered wildlife migrations, and more destructive storms threatening cultural resources and park facilities. The network's data come from NOAA's NClimDiv dataset (version v1.0.0-20230106).
Sources
Based on "2022 Weather in Review: Hopewell Furnace National Historic Site," National Park Service, Mid-Atlantic Inventory and Monitoring Network, with data from NOAA's Climate at a Glance program; a work of the United States government in the public domain.
In diesen SammlungenHopewell Furnace National Historic Site
Lizenz: CC0 1.0 (gemeinfrei) · Bearbeitet nach www.nps.gov
1
0
0
0

Kommentare


