
Etwas zu verbessern? Schlag eine Änderung vor.

The report's visual summary. CDC, MMWR.
In brief
- Mycoplasma pneumoniae is a common cause of community-acquired pneumonia (CAP) in school-aged children. In the U.S., infections fell during the COVID-19 pandemic and stayed low through 2023.
- In 2024, discharges of children with M. pneumoniae CAP from U.S. pediatric hospitals rose sharply, reaching about half of all children hospitalized with CAP — and including children under 5, in whom these infections have been reported less often.
- Judged by length of stay and intensive care admissions, the 2024 infections were not more severe than those of 2018–2023.
- Doctors who know about such increases may diagnose and treat the infection better in children of all ages.
Background
M. pneumoniae is a common bacterial cause of respiratory infection. Most infections are mild, but some people develop pneumonia that needs hospital care. It infects all ages, but the highest share of cases has been among children and adolescents aged 5–17. Earlier studies put it behind roughly 10%–30% of hospitalized pediatric CAP.
There is no vaccine. The first-line treatment is a macrolide antibiotic — azithromycin, clarithromycin or erythromycin. Macrolide-resistant infections are widespread in parts of the world but uncommon in the U.S., under 10% of cases.
Infections have risen about every 3–5 years, which mathematical modeling attributes partly to shifting strain types and to more susceptible people as immunity wanes after infection. During the pandemic they were rarely detected. In 2023 they rose in other countries but not in the U.S.; U.S. infections began to climb sharply in April 2024, seen in the share of positive tests and in emergency department data.
How the study was done
The authors used the Pediatric Health Information System (PHIS), which holds clinical and resource-use data for patients aged 18 or younger, from 42 U.S. children's hospitals that reported consistently. They searched ICD-10 discharge codes for CAP and M. pneumoniae infection from January 2018 to December 2024, and compared 2018–2023 (before, during and just after the pandemic) with 2024, testing differences with chi-square and Wilcoxon rank-sum tests.
To check the codes, they compared them with laboratory results at one hospital, Primary Children's Hospital in Salt Lake City: 86% of discharges coded as M. pneumoniae pneumonia had a positive PCR test, and 14% had no test result code for the bacterium.
What they found
Pneumonia overall. Of 5,631,734 hospitalized children, 141,955 (2.5%) had CAP — 2.3% in 2018–2023 and 3.5% in 2024. CAP rose each fall and winter except in 2020–2021, and yearly cases ranged from 10,221 in 2020 to 30,891 in 2024.
The share caused by M. pneumoniae. Across the whole period, an M. pneumoniae code appeared in 11.5% of CAP stays. It was under 5% each year in 2021–2023, rose to 33% in 2024, and peaked at 53.8% in July 2024. In July–December 2024, about half of CAP stays carried the code — the highest level in six years.
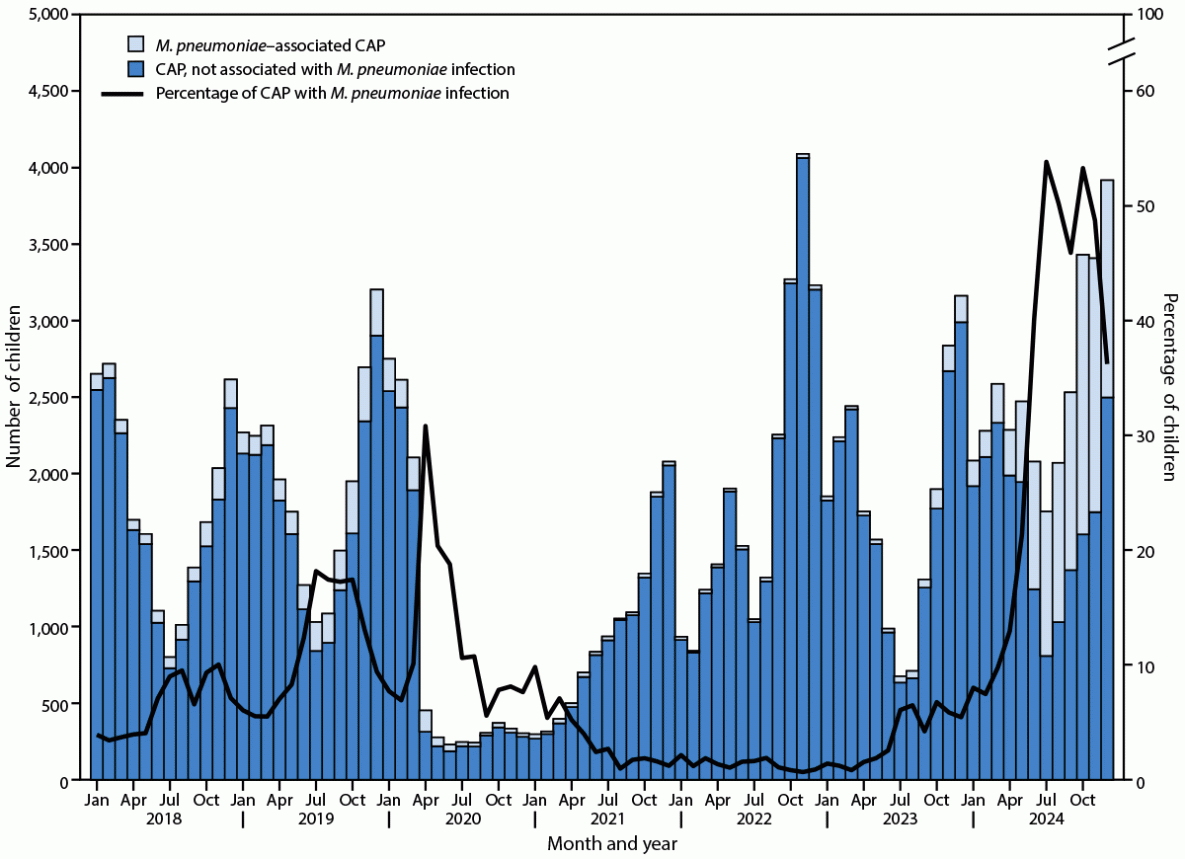
Figure 1. Children hospitalized with CAP, with and without M. pneumoniae*, by month, 42 hospitals, 2018–2024. CDC, MMWR.*
By age. Cases fell in early 2020, stayed low through 2023, and rose in every age group in 2024. Children aged 6–12 had the most cases, followed by those aged 2–5 and 13–18. At its monthly peak, M. pneumoniae's share of CAP was highest among 13–18-year-olds (67.2%), then 6–12 (60.8%), 2–5 (53.4%), 0–11 months (52.0%) and 12–23 months (44.8%). Its share rose most, compared with 2018–2023, among the youngest: 8.5 times at 12–23 months and 8.1 times at 0–11 months, against 7.7 times at 2–5 years, 4.5 at 13–18 and 4.1 at 6–12. In infants and 1-year-olds it accounted for about half of CAP at its peaks, in November and July 2024.

Figure 2. Children hospitalized with M. pneumoniae (A) and its share of CAP (B), by month and age group, 42 hospitals, 2018–2024. CDC, MMWR.
Severity. Stays in 2024 were shorter and a smaller share of children went to intensive care. 44 children died — 29 in 2018–2023 and 15 in 2024 — at a median age of 12.
| M. pneumoniae hospitalizations | 2018–2023 | 2024 |
|---|---|---|
| Cases | 6,055 | 10,298 |
| Per 1,000 hospitalizations | 2.12 | 12.49 |
| Under 1 year | 285 (4.7%) | 405 (3.9%) |
| 1 year | 384 (6.3%) | 662 (6.4%) |
| 2–5 years | 1,491 (24.6%) | 2,719 (26.4%) |
| 6–12 years | 2,474 (40.9%) | 4,485 (43.6%) |
| 13–18 years | 1,421 (23.5%) | 2,027 (19.7%) |
| With a CAP diagnosis | 5,549 (91.6%) | 9,891 (96.0%) |
| Median stay (interquartile range) | 3 days (2–6) | 2 days (1–4) |
| Admitted to intensive care | 1,577 (26.0%) | 2,009 (19.5%) |
| Received an antibiotic effective against M. pneumoniae | 5,774 (95.4%) | 9,908 (96.2%) |
| Died | 29 (0.5%) | 15 (0.1%) |
Across all 42 hospitals, 22.0% of all CAP patients and 95.9% of M. pneumoniae CAP patients got an antibiotic usually considered effective against the bacterium.
What it means
The 2024 rise in the U.S. and elsewhere was larger than most earlier periodic increases. Surveillance and modeling suggest that the years of low circulation during and after the pandemic left more people susceptible. Even so, the hospitalized children of 2024 were not sicker than those of the previous five years.
During such a rise, M. pneumoniae may cause a large share of pneumonia in children of every age, including those under 5. Wider use of multiplex laboratory tests for respiratory pathogens may help recognize it in younger patients. And the close match between codes and lab results at one hospital suggests that discharge codes can track the infection's trends over time.
Increases may come in summer and fall, when other common respiratory germs are low. The infection cannot be identified by physical examination alone, so providers should consider and test for it in children of all ages, especially during periods of high transmission. A confirmed diagnosis guides treatment, because the first-line antibiotic differs from that for other bacterial pneumonias.
Continued surveillance is needed to catch future increases and to improve the models that predict them, and strain typing to follow the dominant genotypes, new variants and antibiotic resistance.
Limitations
- Passively collected resource-use data may reflect testing and coding practices; the lab check at a single hospital may not hold elsewhere, and cases may be undercounted.
- Coinfections and underlying conditions were not examined.
- Lab results, including antibiotic susceptibility, were not available.
- Because most infections are mild, hospitalized cases are only a small part of all infections.
Sources
Based on Maureen H. Diaz, Adam L. Hersh, Jared Olson, Samir S. Shah, Matt Hall and Chris Edens, "Mycoplasma pneumoniae Infections in Hospitalized Children — United States, 2018–2024," MMWR Morbidity and Mortality Weekly Report, volume 74, Centers for Disease Control and Prevention; a work of the United States government in the public domain. The report's list of diagnosis and drug codes, its sex and race and ethnicity breakdowns, and its references are left out; the PDF has them. The report's text calls the spread of hospital stays a "range" where its table gives an interquartile range; this page follows the table.
Lizenz: CC0 1.0 (gemeinfrei) · Bearbeitet nach www.cdc.gov
1
0
0
0

Kommentare


