
¿Quieres mejorar el contenido de la página? Propón un cambio.
###
Mount Rainier Science Brief
For more information contact the **Dragonfly Mercury Project **by email or visit the project website.
Data Source: https://doi.org/10.5066/P9TK6NPT

Dragonfly Mercury Project sample locations in Mount Rainier National Park.
The Dragonfly Mercury Project (DMP) is a national surveillance, monitoring, and research program that brings together citizen engagement and education with scientific efforts to understand mercury (Hg) risks to protected areas. 2020 was the seventh year that Mount Rainier National Park (MORA) participated in the DMP!
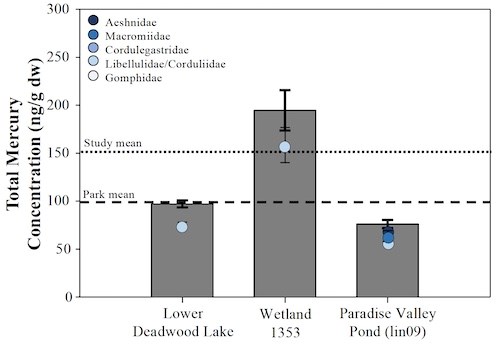
Site (bars), family (points), park (dashed line) and study (dotted line; 2014-2020) mean mercury concentrations in dragonfly larvae collected from MORA in 2020. Park, site, and study mean mercury concentrations are Aeshnid-equivalents, family means are geometric means of raw mercury concentrations.
Summary
Unless noted, all Hg concentrations have been converted to their equivalent concentration in the family Aeshnidae (Eagles-Smith et al. 2020).
The park geometric mean (± standard error) Hg concentration at MORA in 2020 was 113.3 ± 9.2 ng/g dry weight (dw) compared to the overall (across all years of participation) park geometric mean Hg concentration of 98.9 ± 3.1 ng/g dw and the study-wide (2014 – 2020) geometric mean Hg concentration of 151.3 ± 1.0 ng/g dw. Among the three sites sampled from MORA in 2020, geometric mean dragonfly Hg concentrations ranged from 76.0 to 194.7 ng/g dw.
_
Eagles-Smith et al. 2020. A national-scale assessment of mercury bioaccumulation in United States national parks using dragonfly larvae as biosentinels through a citizen-science framework. Environ Sci Technol 54(14):8779–8790. DOI: 10.1021/acs.est.0c01255
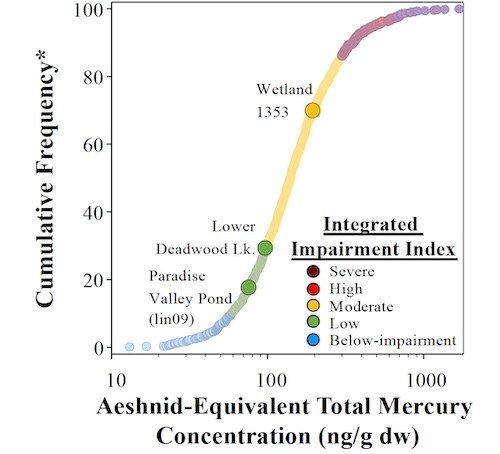
Distribution of site mean Aeshnid-equivalent total mercury concentrations among the five Integrated Impairment Index categories. Sites sampled from MORA in 2020 are highlighted and labeled. *The percent of sites across all parks that have lower Hg concentrations than each of the highlighted sites.
Integrated Impairment Index
- The Integrated Impairment Index classifies Aeshnid-equivalent dragonfly THg concentrations into five categories based on the number of taxa estimated to exceed increasingly severe impairment benchmarks for fish, wildlife, and human health risk. Because the Integrated Impairment Index looks at potential risks to a variety of taxa it provides a more complete estimate of potential health risks than would be seen examining any single benchmark. See Eagles-Smith et al. 2020 for additional details.
- In 2020, two MORA sites were classified as ‘low risk’ and one site as ‘moderate risk’ for Hg impairment.
- Across all parks, 24% of sites sampled in 2020 were classified as ‘low risk’ and 51% were classified as ‘moderate risk’.
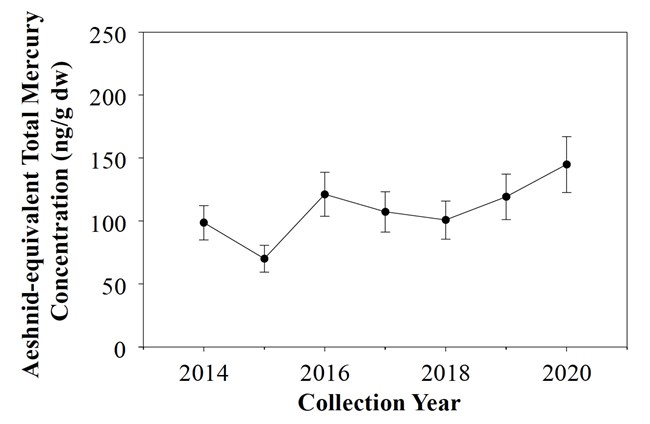
Annual mean total mercury concentrations (Aeshnid-equivalents; ng/g dw ± standard error) in dragonfly larvae collected from MORA between 2014 and 2020. Means are least-squares means from a model that accounts for differences among the sites sampled each year.
Temporal Variation in Dragonfly Hg
In 2020, the mean dragonfly Hg concentration at MORA was similar to the mean concentrations across all sites in 2016 and 2019, but higher than the mean concentrations from 2014, 2015, 2017, and 2018.
What are these data and what do they mean?
We estimated annual mean dragonfly Hg concentrations using a model that takes into account differences in the sites sampled each year of MORA’s participation in the DMP and used a Tukey HSD test to identify differences among annual means. This enables comparisons of Hg concentrations among years and provides insights into temporal variability, despite inconsistencies in which sites were sampled each year. However, any apparent trends in the data must be interpreted cautiously because individual site characteristics have an important influence on dragonfly Hg concentrations. Although these results account for variation due to sampling site, doing so increases the uncertainty in the estimates and thus our power to identify trends.
Public Engagement
The DMP engages local communities and promotes scientific curiosity while harnessing the power of public science to study mercury pollution nationwide.
In 2020, 3 public participants were engaged in dragonfly collections at MORA, with an average of 1.0 public participants per site. Across all sampling efforts, public participants contributed an estimated 5.7 hours to dragonfly sampling at MORA in 2020, averaging 1.9 public participant hours per site. Across all sites, 60% of the dragonfly larvae from MORA with field identifications were correctly identified to family.
Summary Table
| Site | Site Code | Family | N | ID Accur. | Total Length (mm) | Total Mercury (ng/g dw) a | ||
|---|---|---|---|---|---|---|---|---|
| Mean | Range | Mean | Range | |||||
| Lower Deadwood Lake | MRNP040 | Corduliidae/Libellulidae | 11 | 100% | 20.1 | 17.1 - 21.8 | 74.9 | 62.6 - 92.6 |
| Wetland 1353 | MRNP077 | Corduliidae/Libellulidae | 12 | 0% | 15.0 | 13.4 - 16.9 | 158.3 | 76.6 - 315.5 |
| Paradise Valley Pond (lin09) | MRNP137 | Aeshnidae | 8 | 100% | 22.0 | 19.3 - 29.8 | 69.6 | 60.7 - 86.1 |
| Corduliidae/Libellulidae | 2 | 0% | 16.5 | 15.9 - 17.1 | 57.3 | 57.1 - 57.6 | ||
| Macromiidae | 2 | 100% | 22.2 | 21.1 - 23.3 | 63.5 | 58.1 - 69.3 |
araw Hg concentrations not converted to Aeshnid-equivalents
Where this belongs
- Mount Rainier National Park
Where this page came from
This page was imported from National Park Service. Produced by the U.S. National Park Service and, as a work of the United States government, in the public domain.
Nobody has written it yet — it is the source material at a new address, which is why search engines are asked to skip it and why no one earns from it. It is up for grabs: take it on, and it is yours to rewrite and to earn from.
En estas coleccionesMount Rainier National Park
Licencia: CC0 1.0 (dominio público) · Adaptado de www.nps.gov
1
0
0
0

Comentarios
Sigue leyendo


