
¿Ves algo que mejorar? Propón un cambio.
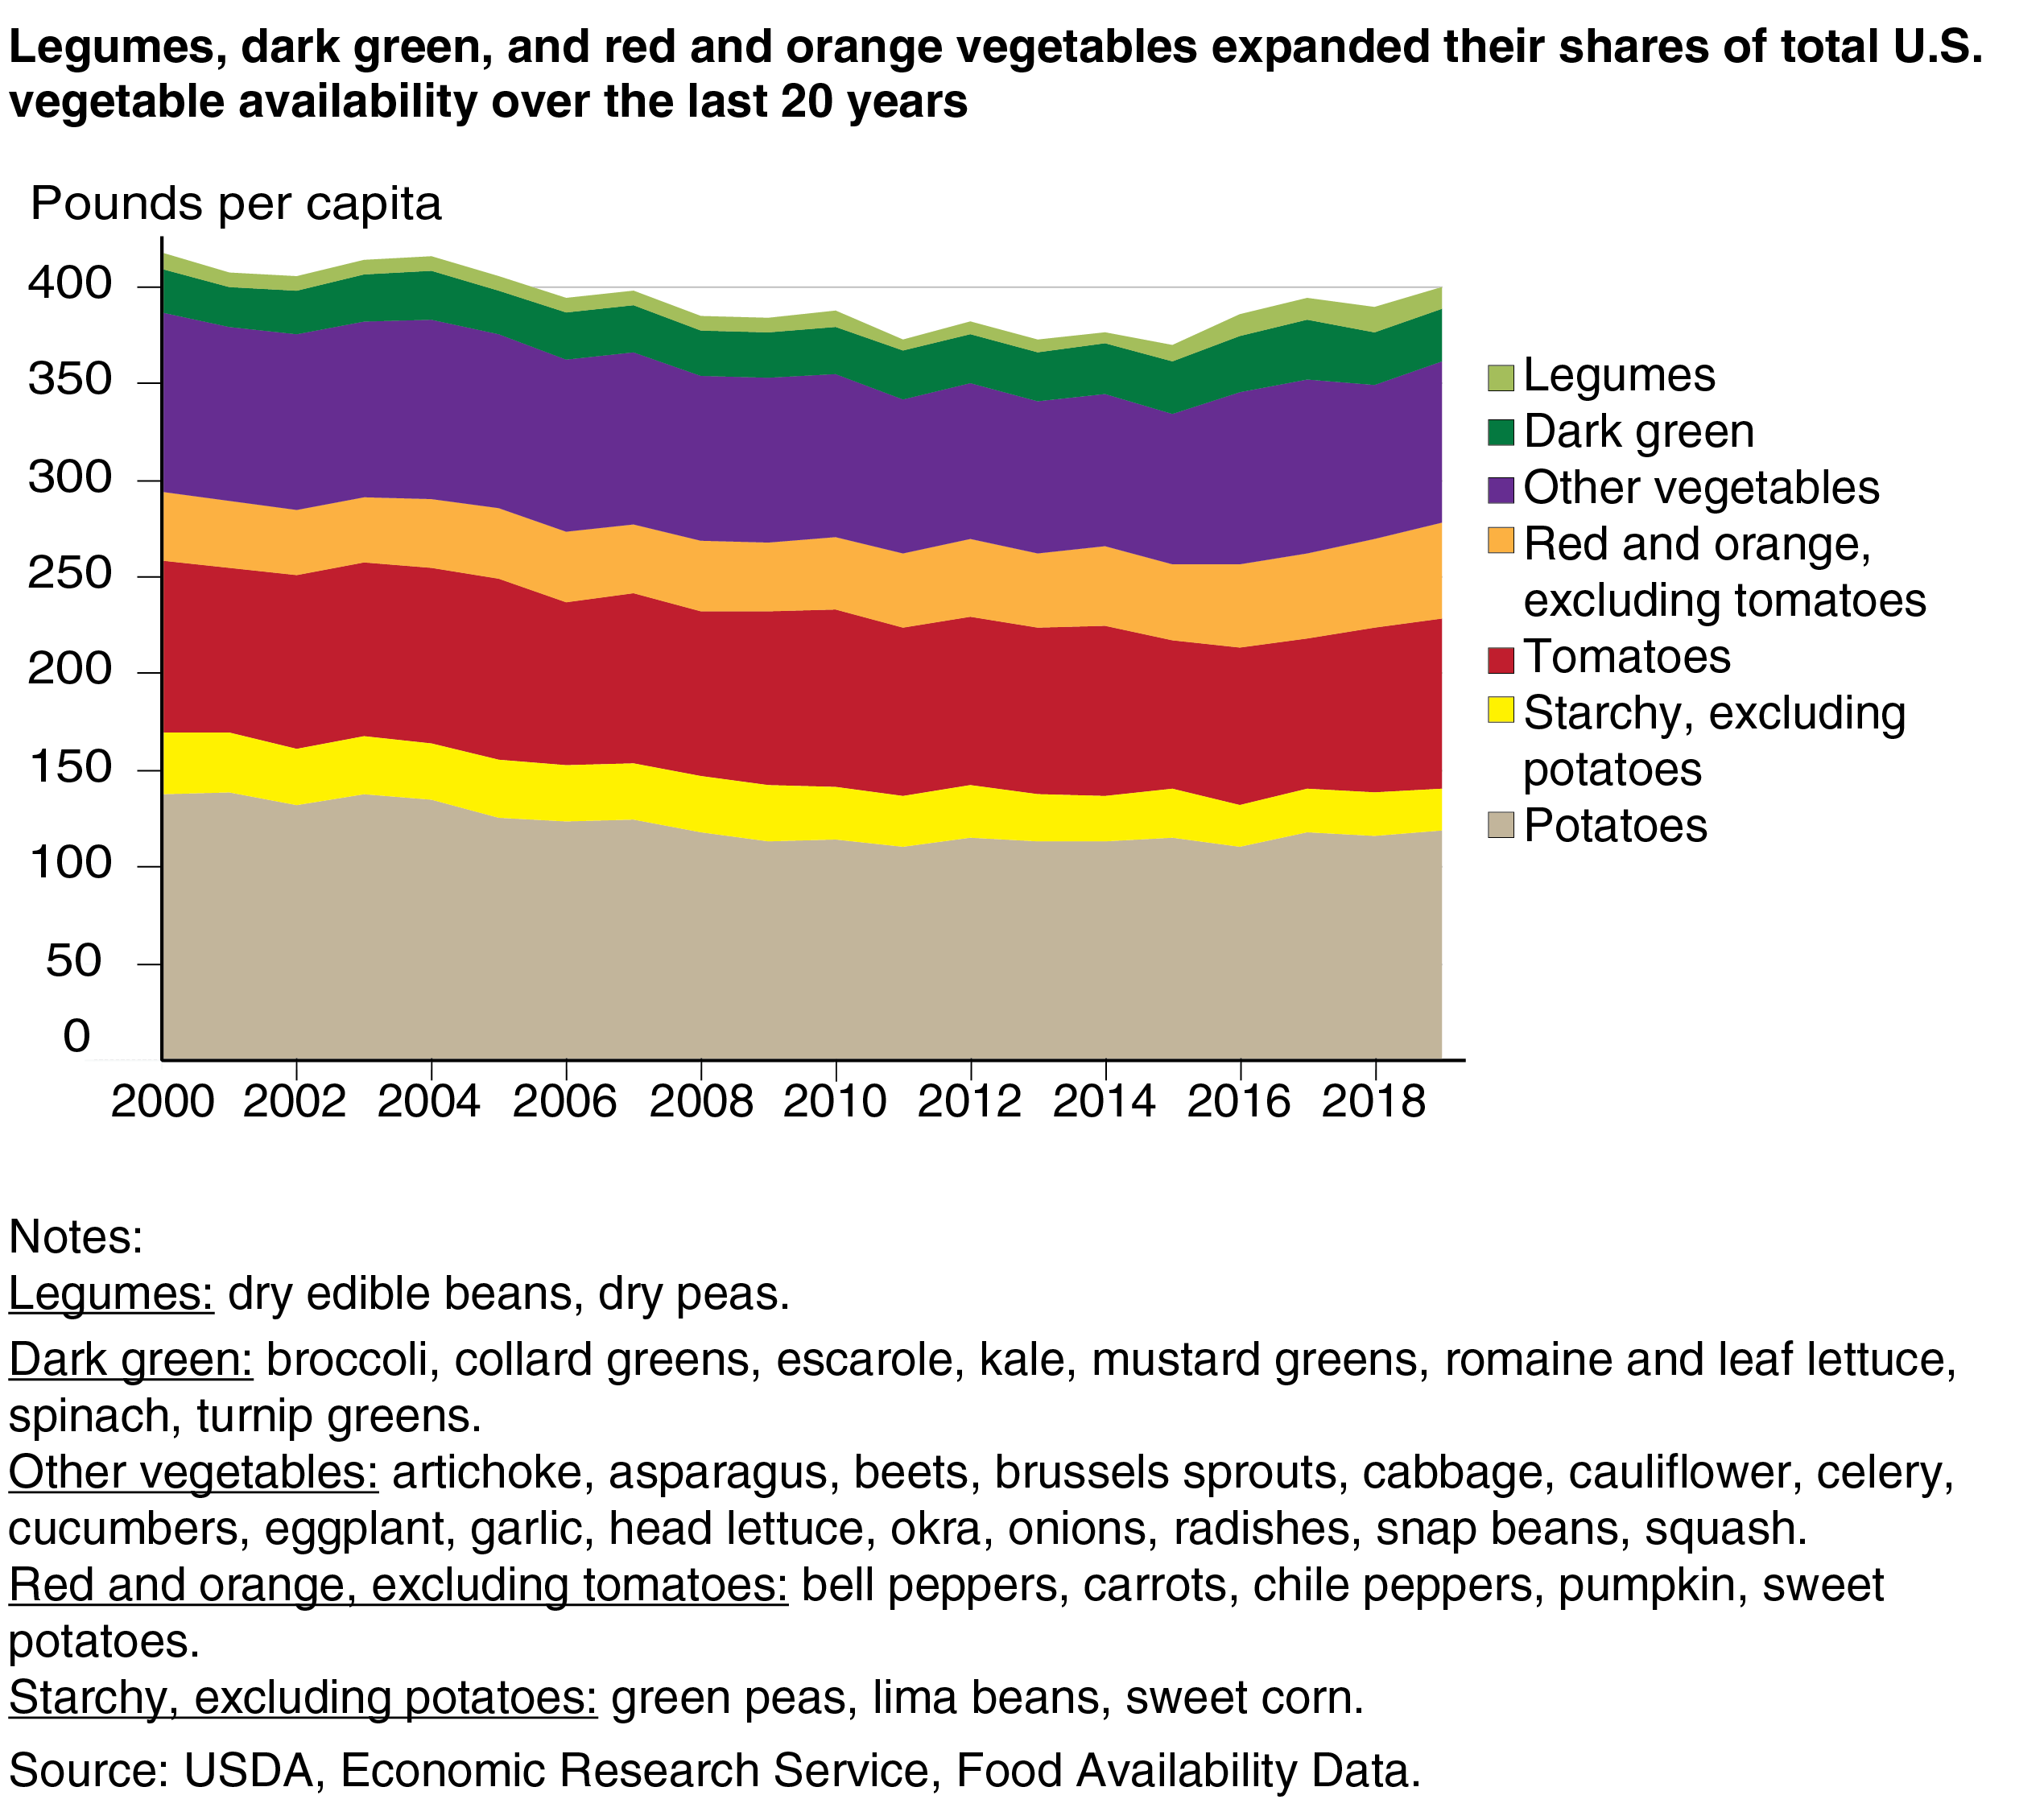
The Federal Dietary Guidelines for Americans encourages a diet that includes a variety of nutrient-dense foods chosen from across and within food groups. The vegetables food group is composed of five subgroups: dark green, red and orange, starchy, other vegetables, and legumes (beans and peas). Each offers an array of important vitamins, minerals, and dietary fiber. Data from the USDA, Economic Research Service (ERS) reveal that Americans are slowly expanding the variety of vegetables on their plates. From 2000 to 2019, dark green vegetables, red and orange vegetables (excluding tomatoes), and legumes increased their combined share of the vegetables available to eat in the United States from 16 percent to 22 percent.
ERS’s Food Availability (Per Capita) Data System provides annual estimates for more than 200 food commodities of the amount available per capita for consumption in the United States. ERS calculates national supplies of food commodities available for domestic consumption by adding domestic production, initial inventories, and imports of a particular commodity, and then subtracting exports and end-of-year inventories. To calculate per capita estimates, these national supplies are divided by the U.S. population.
Over the last two decades, the total amount of vegetables available decreased by 4 percent from 417.4 pounds per capita to 400.1 pounds, rebounding from a low of 369.6 pounds in 2015. ERS’s food availability data for vegetables include fresh, frozen, canned and dried forms, all measured in fresh-weight equivalents. Some vegetable subgroups have increased in popularity, while others have seen declines.
Those subgroups posting declines included white potatoes and “other vegetables,” a subgroup containing 16 different vegetables. Availability of white potatoes fell from 138.0 pounds per capita to 119.1 pounds between 2000 and 2019, and other starchy vegetables fell from 31.3 to 21.2 pounds. Availability of other vegetables fell from 93.6 pounds per capita to 83.7 pounds. Declines in head lettuce, cabbage, and beets in that subgroup were partially offset by increased availability of onions and cucumbers.
Other subgroups posted increases in supplies available to eat between 2000 and 2019. The red and orange subgroup (excluding tomatoes, for which availability remained flat) had the largest increase in availability, growing from 35.1 pounds per capita to 49.0 pounds. In terms of growth in availability, sweet potatoes, chile peppers, and bell peppers were the leaders. In 2019, per capita availability of sweet potatoes, chile peppers, and bell peppers had risen to 7.9, 7.3, and 11.3 pounds, respectively.
Increased availability of dark green vegetables from 2000 to 2019—led by a 47-percent jump in romaine and leaf lettuce—added variety to American’s vegetable choices. Higher supplies of kale, spinach, and broccoli also helped boost availability of dark green vegetables from 21.7 pounds per capita in 2000 to 27.5 pounds in 2019.
Supplies of legumes available to eat grew from 8.5 pounds per capita to 11.1 pounds between 2000 and 2019. A 10-percent decline in availability of dry edible beans to 6.9 pounds per capita was overridden by a 420-percent increase in availability of dry peas and lentils to 4.2 pounds.
This article is drawn from:
Food Availability (Per Capita) Data System.
(n.d.).
U.S. Department of Agriculture, Economic Research Service.
Where this page came from
This page was imported from USDA Economic Research Service. Published by the USDA Economic Research Service and, as a work of the United States government, in the public domain.
Nobody has written it yet — it is the source material at a new address, which is why search engines are asked to skip it and why no one earns from it. It is up for grabs: take it on, and it is yours to rewrite and to earn from.
Licencia: CC0 1.0 (dominio público) · Adaptado de www.ers.usda.gov
1
0
0
0

Comentarios


