Quelque chose à améliorer ? Proposez une modification.
Related Materials

[JPG - 327 KB]](https://www.cdc.gov/mmwr/volumes/69/wr/social-media/mm6946a6_COVID19StatsUrbanRural_IMAGE_20Nov20_1200x675.jpg)

Click here to see a simplified version of this graph for use on social media.
Abbreviation: COVID-19 = coronavirus disease 2019.
- Incidence = cases per 100,000 population calculated using 2019 U.S. census population.
† Large central metro: counties in metropolitan statistical areas (MSAs) of ≥1 million population that 1) contain the entire population of the largest principal city of the MSA, 2) have the entire population contained in the largest principal city of the MSA, or 3) contain ≥250,000 inhabitants of any principal city of the MSA; Large fringe metro: counties in MSAs of ≥1 million population that did not qualify as large central metro counties; Medium metro: counties in MSAs of 250,000–999,999 population; Small metro: counties in MSAs of 50,000–249,999 population; Micropolitan: counties centered on an urban cluster with 10,000–49,999 population; Noncore: nonmetropolitan counties that did not qualify as micropolitan. https://www.cdc.gov/nchs/data_access/urban_rural.htm#2013_Urban-Rural_Classification_Scheme_for_Counties.
§ Data are provisional and subject to change.
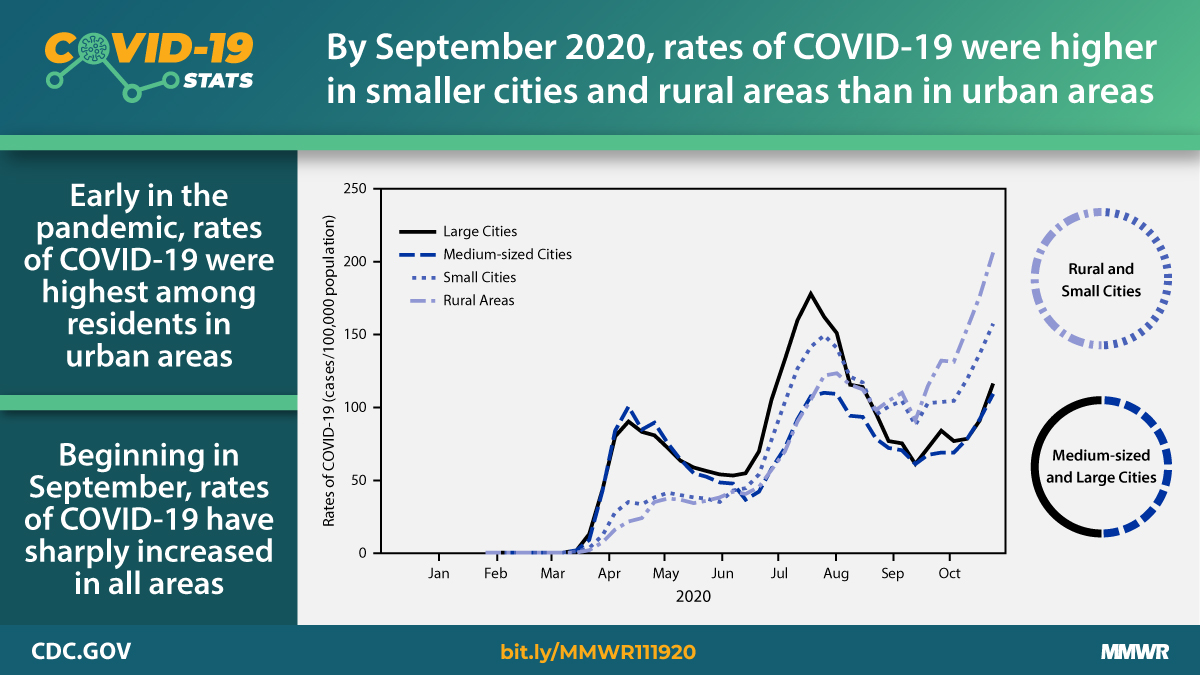
Early in the pandemic, from mid-March to mid-May, COVID-19 incidence was highest among residents of large central and large fringe metropolitan areas. Beginning in mid-April, incidence in large metropolitan (central and fringe) areas declined and then increased similarly among all urban-rural areas. In September 2020, COVID-19 incidence sharply increased, and it remains highest among residents of medium/small metropolitan areas and micropolitan/noncore areas, indicating increased spread into rural communities. In October, weekly incidence was increasing steadily among all urban-rural areas.
Source: Protect USAFacts. https://usafacts.org/visualizations/coronavirus-covid-19-spread-map/.
Reported by: Lindsey M. Duca, PhD, pgz5@cdc.gov; Jayme Coyle, PhD; Carter McCabe, MPH; Catherine A. McLean, MD.
Where this page came from
This page was imported from Centers for Disease Control and Prevention. Material produced by the Centers for Disease Control and Prevention is a work of the United States government and is in the public domain.
Nobody has written it yet — it is the source material at a new address, which is why search engines are asked to skip it and why no one earns from it. It is up for grabs: take it on, and it is yours to rewrite and to earn from.
Licence : CC0 1.0 (domaine public) · Adapté de www.cdc.gov
1
0
0
0

commentaires