
Vedi qualcosa da migliorare? Proponi una modifica.
CDC works with other federal agencies to spot hotspots — counties where COVID-19 cases are rising — and helps state, tribal, local and territorial health departments slow the spread there. To find where prevention could help most, CDC asked: in which age groups does the rise start?
The measure was percent positivity — the share of SARS-CoV-2 RT-PCR tests that come back positive — an important sign of community transmission.
How hotspots were defined
A county counted as a hotspot when it had more than 100 cases in the past 7 days and cases had been rising over the preceding 3–7 days. The analysis took counties that became hotspots between June 1 and July 31, 2020, and had not met the criteria in the previous 21 days.
For each, positivity was tracked by age — 0–17, 18–24, 25–44, 45–64 and 65 and older — from 45 days before to 45 days after the county was flagged (spanning April–September 2020), as a 7-day moving average, using test results reported by state health departments and laboratories.
The 767 hotspot counties made up 24% of U.S. counties and held 63% of the U.S. population.
Young people first
| Age | Positivity began rising, before detection | Positivity at detection |
|---|---|---|
| 0–17 | 31 days | 11% |
| 18–24 | 31 days | 14% — highest |
| 25–44 | 28 days | 10% |
| 45–64 | 23 days | 8% |
| 65 and older | 20 days | 6% |
- For 18- to 24-year-olds, positivity was already near its peak of 15% when the county was flagged.
- In every other age group it kept climbing for 21 to 33 days after detection, peaking at 10% to 14%, and it fell more slowly than among 18- to 24-year-olds.
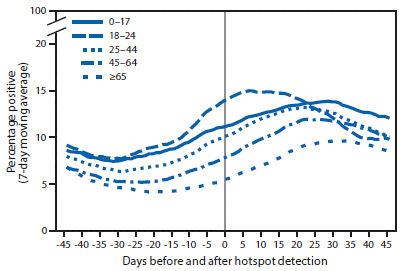
Positive SARS-CoV-2 RT-PCR tests (7-day moving average) in hotspot counties before and after detection, by age group, United States, June 1–July 31, 2020. CDC
By region
| Census region | Hotspot counties | Pattern |
|---|---|---|
| South | 488 | followed the national trend, with higher positivity than the West in every age group |
| West | 98 | followed the national trend |
| Midwest | 134 | positivity among 18- to 24-year-olds peaked before detection; other ages rose only slightly |
| Northeast | 47 | a small rise among 18- to 24-year-olds; little or none in other ages |

Positive SARS-CoV-2 RT-PCR tests (7-day moving average) in hotspot counties before and after detection, by age group and Census region, United States, June 1–July 31, 2020. CDC
What it means
- Rising positivity among older people is likely to bring more hospitalizations, severe illness and deaths — and in these counties it followed the young by several weeks, especially in the South and West.
- The findings match earlier regional patterns in the southern United States, where rising positivity among adults aged 20–39 came before rises among those 60 and older — and they show that 18- to 24-year-olds rise earliest of all.
- Cutting transmission among young adults is an urgent priority, both to protect the people at highest risk of severe illness or death and because COVID-19 incidence among young adults had recently been increasing.
- Health care in hotspot counties must be ready: cases and hospitalizations among older people are likely to rise in the weeks after a county meets the hotspot criteria.
About the data
Test results came from state health departments' electronic laboratory reporting in 37 states, and directly from a subset of public health, commercial and reference laboratories — about half of all tests — in 13 states and the District of Columbia. They may miss some testing sites, such as point-of-care sites; they count tests, not people; and they leave out antibody and antigen tests. CDC and other agencies were still refining how hotspots are defined, so later reports may use different terms.
Sources
Based on Oster AM, Caruso E, DeVies J, Hartnett KP, Boehmer TK, "Transmission Dynamics by Age Group in COVID-19 Hotspot Counties — United States, April–September 2020," MMWR volume 69, number 41, Centers for Disease Control and Prevention; a work of the United States government in the public domain.
Licenza: CC0 1.0 (pubblico dominio) · Tratto da www.cdc.gov
1
0
0
0

Commenti


