Vuoi migliorare il contenuto della pagina? Prova a proporre una modifica.
Jennifer L. Goldman, MD1; Brian R. Lee, PhD1; Janelle Porter, DSW2; Anila Deliu, MPH2; Shannon Tilsworth, MSN2; Olivia M. Almendares, MSPH3; Sadia Sleweon, MPH3; Hannah L. Kirking, MD3; Rangaraj Selvarangan, PhD1; Jennifer E. Schuster, MD1 (
Related Materials
Close
Download Image[JPG]
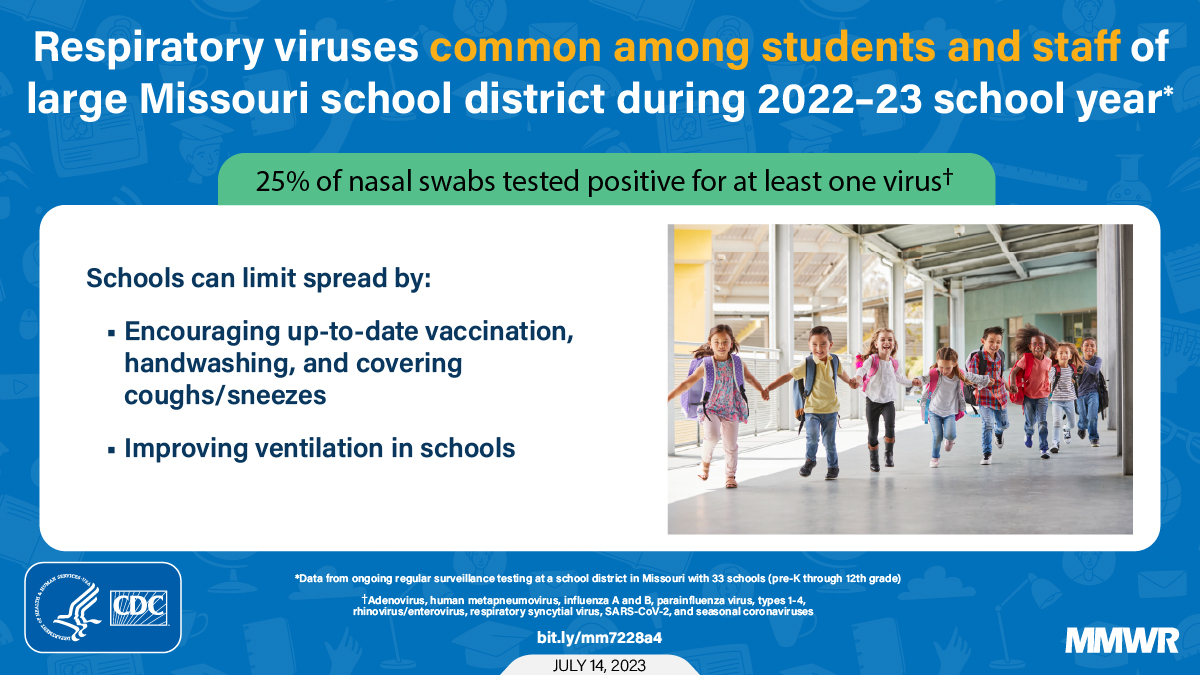
Respiratory virus infections are common in school-aged children (1). Although children spend most of their awake hours in the school setting, few data are available on the prevalence of respiratory viruses in schools. Surveillance for respiratory viruses other than SARS-CoV-2 has not been widely conducted in primary and secondary schools (2).
Prospective Surveillance and Preliminary Results
To determine the prevalence of respiratory viruses in school students and staff members, prospective surveillance was implemented in a large metropolitan school district in Kansas City, Missouri with 33 pre-Kindergarten (pre-K)–grade 12 schools during the 2022–23 school year. All district students and staff members were eligible to enroll in opt-in respiratory virus testing and symptom surveys irrespective of the presence of symptoms; enrollment information was sent by the school district using existing communication channels. Self-collected anterior nasal swabs were obtained monthly and tested using multiplex viral polymerase chain reaction.* Thirty-six hours before each scheduled monthly test, an electronic survey was sent to enrolled participants (or their parent or guardian) inquiring about respiratory virus infection symptoms during the preceding 7 days.† Logistic regression models were used to compare positivity across age groups. Regression models accounted for clustering within schools when calculating cluster-robust SEs. Percentile-based bootstrapped CIs were calculated using Stata 17 software (version 17.0; StataCorp). The goal of this report is to share timely virus testing results during ongoing surveillance. This activity was reviewed by CDC and was conducted consistent with applicable federal law and CDC policy.§
Among the 894 total participants, 639 (71.5%) were students (representing 3.0% of total district enrollment of 21,419), and 255 (28.5%) were staff members (representing 7.1% of the total 3,577 district full-time staff members). Demographic characteristics of participants were similar to those reported districtwide, except that the proportion of female participants was higher (60.7%) than that from districtwide estimates (51.1%), and the proportion of students qualifying for free or reduced price meals was lower (31.3% versus 38.0%)¶ (3). Among students, the median age was 10.1 years (IQR = 7.5–12.5 years), 289 (45.2%) were male, 406 (63.5%) were non-Hispanic White (White), 80 (12.5%) were Hispanic or Latino (Hispanic), 49 (7.7%) were non-Hispanic multiracial (multiracial), and 46 (7.2%) were non-Hispanic Black or African American (Black). Among staff members, the median age was 42.2 years (IQR = 34.3–51.1 years), 21 (8.2%) were male, 214 (83.9%) were White, 12 (4.7%) were Hispanic, seven (2.7%) were multiracial, and five (2.0%) were Black.
A total of 3,232 surveillance specimens were tested, including 872 (27.0%) from staff members and 2,360 (73.0%) from students (
Among the 3,232 symptom surveys sent, 2,393 (74.0%) were completed. Pre-K students had the highest prevalence of reporting one or more symptoms (41.1%) compared with high school students, among whom prevalence of symptoms was lowest (14.0%) (p
Preliminary Conclusions
The findings in this report are subject to at least three limitations. First, participation in this program is voluntary; participants who opt in might not be representative of the full school population. Second, all nasal swabs were collected by participants, and approximately 25% of specimens did not have known symptomatology because of lack of survey response. Finally, this early report describes positive laboratory results, not the likelihood of individual students or staff members receiving a positive test result during the school year.
The COVID-19 pandemic highlighted the gap in knowledge related to the prevalence and symptoms of respiratory viruses among children and in schools. These data are important to improve understanding of the epidemiology of respiratory viruses in a school setting, including but not limited to SARS-CoV-2. To support healthy learning environments for all, it is important to implement strategies to prevent and reduce the spread of infectious diseases, including staying up to date with recommended vaccinations, including COVID-19 and influenza vaccines, practicing good hand hygiene and respiratory etiquette, staying home when sick, and improving indoor ventilation. Final results of this surveillance effort will assist in refining the spectrum of panrespiratory approaches to respiratory virus prevention and could direct guidance in primary and secondary schools.
Acknowledgments
Dithi Banerjee, Micheal Brown, Tamoor Chohdry, Kathryn Figueroa-Nieves, Amanda Hayes, Christopher Hsu, Mandy Morgan, Sydnie Petty, Anjana Sasidharan, Krista Ladue Wright, Chris Young; students and staff members described in this report.
Corresponding author: Jennifer E. Schuster, jeschuster@cmh.edu.
1Children’s Mercy Kansas City, Kansas City, Missouri; 2North Kansas City School District, Kansas City, Missouri; 3Coronavirus and Other Respiratory Viruses Division, National Center for Immunization and Respiratory Diseases, CDC.
All authors have completed and submitted the International Committee of Medical Journal Editors form for disclosure of potential conflicts of interest. Jennifer L. Goldman reports institutional support from the National Institutes of Health, a speaking honorarium from the Missouri Chapter of the American Academy of Pediatrics, and compensation for serving on the Food and Drug Administration’s Pediatric Advisory Committee. Brian R. Lee reports institutional support from Pfizer for an unrelated study. Jennifer E. Schuster reports institutional support from the National Institutes of Health, the Food and Drug Administration, and the State of Missouri, speaking honoraria from the Missouri Chapter of the American Academy of Pediatrics, and compensation for serving on an Association of American Medical Colleges advisory board. Rangaraj Selvarangan reports institutional support from Biomerieux, Cepheid, Hologic, Biorad, Luminex, Diasorin, and Qiagen, receipt of consulting fees from Baebies, Inc., and honoraria from GlaxoSmithKline and Abbott. No other potential conflicts of interest were disclosed.
- Testing was performed using Hologic Panther Fusion Assays for adenovirus; human metapneumovirus; influenza A and B viruses; parainfluenza virus, types 1–4; rhinovirus/enterovirus, RSV, and SARS-CoV-2; and seasonal coronaviruses, including 229E, HKU1, NL63, and OC43.
† Surveys were deployed using Research Electronic Data Capture via text message or email based on parent (for students) or participant (for staff members) preference. Parents and staff members were asked whether participants had respiratory virus infection signs and symptoms (i.e., fever, cough, nasal congestion, runny nose, sore throat, wheezing, shortness of breath, or none of the above) during the previous 7 days and were instructed to select all that applied.
§ 45 C.F.R. part 46.102(l)(2), 21 C.F.R. part 56; 42 U.S.C. Sect. 241(d); 5 U.S.C. Sect. 552a; 44 U.S.C. Sect. 3501 et seq.
¶ Participants enrolled were 60.7% female, 78.7% White, 6.9% Black, 7.7% multiracial, 11.3% Hispanic, 92.8% with English as their preferred language, and 31.3% qualified for free or reduced meals. School districtwide demographic characteristics for the 2022–23 school year were 51.0% female, 71.0% White, 10.4% Black, 4.5% multiracial, 10.3% Hispanic, 88.1% with English as their preferred language, and 38.0% qualified for free or reduced meals.
** Enrollment was ongoing at the time of analysis.
References
- Perez A, Lively JY, Curns A, et al.; New Vaccine Surveillance Network Collaborators. Respiratory virus surveillance among children with acute respiratory illnesses—New Vaccine Surveillance Network, United States, 2016–2021. MMWR Morb Mortal Wkly Rep 2022;71:1253–9. https://doi.org/10.15585/mmwr.mm7140a1 PMID:36201373
- Kalu IC, Zimmerman KO, Goldman JL, et al. SARS-CoV-2 screening testing programs for safe in-person learning in K–12 schools. J Pediatric Infect Dis Soc 2023;12:64–72. https://doi.org/10.1093/jpids/piac119 PMID:36412278
- US Census Bureau. Census reporter. North Kansas City 74 School District, MO. Suitland, MD: US Department of Commerce, US Census Bureau; 2023. Accessed May 25, 2023. https://censusreporter.org/profiles/97000US2922800-north-kansas-city-74-school-district-mo/
- Hamid S, Winn A, Parikh R, et al. Seasonality of respiratory syncytial virus—United States, 2017–2023. MMWR Morb Mortal Wkly Rep 2023;72:355–61. https://doi.org/10.15585/mmwr.mm7214a1 PMID:37022977
- Thomas CM, White EB, Kojima N, et al. Early and increased influenza activity among children—Tennessee, 2022–23 influenza season. MMWR Morb Mortal Wkly Rep 2023;72:49–54. https://doi.org/10.15585/mmwr.mm7203a1 PMID:36656786
| Virus detected, no. (%) | School level, no. of specimens (% of total) | |||||||||
|---|---|---|---|---|---|---|---|---|---|---|
| Pre-K n = 90 (2.8) | Elementary school n = 1,413 (43.7) | Middle school n = 479 (14.8) | High school n = 378 (11.7) | Staff members n = 872 (27.0) | ||||||
| No. | % (95% CI) | No. | % (95% CI) | No. | % (95% CI) | No. | % (95% CI) | No. | % (95% CI) | |
| Any virus detection, 805 (24.9)* | 36 | 40.0 (26.4–45.2) | 466 | 33.0 (29.6–36.7) | 117 | 24.4 (18.1–29.2) | 63 | 16.7 (12.9–20.5) | 123 | 14.1 (10.9–16.5) |
| Rhinovirus/Enterovirus, 392 (12.1) | 13 | 14.4 (3.2–29.8) | 241 | 17.1 (14.5–20.0) | 65 | 13.6 (7.9–17.6) | 31 | 8.2 (6.0–10.3) | 42 | 4.8 (3.2–6.5) |
| Adenovirus, 70 (2.2) | 11 | 12.2 (7.6–21.0) | 46 | 3.3 (2.2–4.5) | 7 | 1.5 (0.8–3.8) | 3 | 0.8 (0.4–2.5) | 3 | 0.3 (0.1–0.8) |
| Seasonal coronavirus, 181 (5.6) | 6 | 6.7 (2.9–8.8) | 114 | 8.1 (6.7–9.3) | 17 | 3.5 (1.1–5.8) | 11 | 2.9 (1.2–4.9) | 33 | 3.8 (2.7–5.0) |
| Human metapneumovirus, 93 (2.9) | 4 | 4.4 (2.4–11.9) | 52 | 3.7 (2.6–5.0) | 13 | 2.7 (1.0–4.2) | 7 | 1.9 (1.2–3.2) | 17 | 1.9 (0.9–3.2) |
| SARS-CoV-2, 77 (2.4) | 2 | 2.2 (1.5–4.2) | 29 | 2.1 (1.3–2.9) | 9 | 1.9 (0.7–3.8) | 8 | 2.1 (0.7–4.8) | 29 | 3.3 (2.0–5.2) |
| Parainfluenza virus, 29 (0.9) | 2 | 2.2 (1.0–8.5) | 13 | 0.9 (0.5–1.3) | 5 | 1.0 (0.3–2.5) | 4 | 1.1 (0.6–3.3) | 5 | 0.6 (0.2–1.3) |
| RSV, ✝ 23 (0.7) | 1 | 1.1 (0.6–2.8) | 11 | 0.8 (0.3–1.4) | 5 | 1.0 (0.5–2.8) | 4 | 1.1 (0.3–3.0) | 2 | 0.2 (0.1–0.6) |
| Influenza A, † 21 (0.6) | 0 | — | 11 | 0.8 (0.4–1.2) | 5 | 1.0 (0.4–2.5) | 2 | 0.5 (0.2–1.1) | 3 | 0.3 (0.1–0.7) |
| Influenza B, 2 (0.1) | 0 | — | 0 | — | 1 | 0.2 (0.1–1.2) | 0 | — | 1 | 0.1 (0.1–0.1) |
| Reported symptoms during previous 7 days, no. | ||||||||||
| Asymptomatic, 1,628 | 28 | 31.1 (18.0–41.6) | 657 | 46.5 (42.0–51.2) | 246 | 51.4 (37.8–57.2) | 220 | 58.2 (46.9–65.4) | 477 | 54.7 (49.0–60.7) |
| One or more symptoms, 765 | 37 | 41.1 (32.3–65.0) | 343 | 24.3 (21.3–27.5) | 111 | 23.2 (18.0–33.6) | 53 | 14.0 (6.8–18.6) | 221 | 25.3 (21.3–29.6) |
| Survey not completed, 839 | 25 | 27.8 (3.1–40.2) | 413 | 29.2 (24.1–34.1) | 122 | 25.5 (18.6–36.4) | 105 | 27.8 (19.9–45.8) | 174 | 20.0 (15.5–24.6) |
- Viral detections are not mutually exclusive.
✝ RSV peak occurred during October–November 2022; influenza peak occurred during October–December 2022. https://www.cdc.gov/surveillance/resp-net/dashboard.html (Accessed July 6, 2023).
Where this page came from
This page was imported from Centers for Disease Control and Prevention. Material produced by the Centers for Disease Control and Prevention is a work of the United States government and is in the public domain.
Nobody has written it yet — it is the source material at a new address, which is why search engines are asked to skip it and why no one earns from it. It is up for grabs: take it on, and it is yours to rewrite and to earn from.
Licenza: CC0 1.0 (pubblico dominio) · Tratto da www.cdc.gov
1
0
0
0

Commenti
Da leggere dopo