
Arkansas experienced wide extremes in climate variability during the period of 2005 to 2010, recording the largest annual precipitation ever recorded in the State (100.05 inches [in.]) in 2009 (National Weather Service, 2012). Many weather stations across the State reported between 80 to 90 in. of rainfall in 2009. For comparison, the average annual precipitation in Little Rock, Arkansas, for the period 1878 to 2010 was 47.1 in. (fig. 1). In contrast, 2005 and 2010 were the 7th and 14th driest years on record in Little Rock with 34.55 and 36.52 in., respectively; both tied as the hottest years ever recorded in Arkansas (National Oceanic and Atmospheric Administration, 2011). The wettest year on record in Little Rock (2009) was interspersed within these dry years, with a total of 81.79 in. Fifteen weather stations within the State ranked 2009 as the wettest year on record (National Weather Service, 2012).
Extremes in annual precipitation rates may lead to greater variability in groundwater recharge rates and water use, particularly in the agricultural areas in eastern Arkansas that rely heavily on groundwater produced from the Mississippi River Valley alluvial aquifer (hereafter referred to as the alluvial aquifer). How does this variability affect the groundwater system and water use therein? Are the effects of this variability discernable in measured water levels in wells? Czarnecki and Schrader (2012) examined these questions and provided some insights, the results of which are presented here.
Water-Level Monitoring Network
The U.S. Geological Survey (USGS) monitors water levels in about 1,100 water wells throughout Arkansas in conjunction with the Arkansas Natural Resources Commission, Arkansas Geological Survey, Union County Conservation District, and U.S. Department of Agriculture Natural Resources Conservation Service. Water levels in about 600 wells completed in the alluvial aquifer are measured during the spring prior to the irrigation season to allow the water level in a well to stabilize and to better reflect conditions within the aquifer. Arkansas County (fig. 2) is one of several areas in the State that has experienced substantial declines in water levels because of groundwater pumping for irrigation. Periodic and continuous water levels are monitored as part of the USGS water-level monitoring network.

Figure 1. Precipitation for Adams Field in Little Rock, Arkansas, for the period 1878 to 2010 (National Weather Service, 2011).
Between 2004 and 2010, water levels generally declined and then rose similar to annual precipitation (fig. 1). Water-level change maps generated using water-level data collected 4 years apart (Schrader, 2010) are shown in figure 3. Such maps are useful in observing regional trends in water levels that might correlate with changes in recharge and water-use rates. Water levels decreased an average of 1.62 feet (ft) in eastern Arkansas with a median value of 2.00 ft between 2004 and 2008, in part, as a result of the small amount of precipitation in 2005. Water levels rose an average of 1.36 ft with a median value of 0.82 ft between 2006 and 2010, resulting from the record amount of precipitation in 2009. From 2004 to 2008, water levels in most wells decreased 0 to 6 ft, whereas from 2006 to 2010, water levels in most wells increased 0 to 4 ft (fig. 4). The average increase in water levels of about 3 ft between dry (2004 to 2008) and wet (2006 to 2010) periods represents an approximate increase in groundwater storage of about 10 million acre-ft, assuming a specific yield of 0.3 and an area covered by the alluvial aquifer of 17,000 square miles (mi). Available water-level data were sufficient to show that water-level change on a regional scale was affected by climate variability.

Figure 3. Four-year water-level difference in the Mississippi River Valley alluvial aquifer in eastern Arkansas (A) 2004–8, and (B) 2006–10.

Figure 4. Differences in water-level altitudes for the alluvial aquifer in eastern Arkansas.
Water Use and Conservation
Observed water-level rises between 2006 and 2010 resulted, in part, from reduced water use. Record precipitation rates in 2009 likely resulted in decreased water use. A total of 7.87 million acre-ft of groundwater was pumped from the alluvial aquifer in 2008 compared to a total of 0.17 million acre-ft from the Sparta aquifer. In 2009, total groundwater pumpage from the alluvial aquifer decreased by 22.9 percent to 6.07 million acre-ft, and from the Sparta aquifer by 17.6 percent to 0.144 million acre-ft (Czarnecki and Schrader, 2012). The five largest water users by county of all the water pumped from the alluvial aquifer in 2008 were Clay (9.2 percent), Poinsett (9.0 percent), Cross (7.8 percent), Jackson (5.6 percent), and Arkansas (5.4 percent) Counties (fig. 5). A closer inspection of water use in Arkansas County (fig. 6) shows that water use peaked in 2000, and had the second largest water use by county (8.6 percent) from the alluvial aquifer with Poinsett County ranking first with 9.0 percent of the total water use (Terrance E. Holland, U.S. Geological Survey, written commun., 2011). The occurrence of record precipitation in 2009 is insufficient to explain the decline in water use in Arkansas County since 2000. Reasons for the subsequent decline in water use in Arkansas County from 2000 to 2009 may include use of tailwater recovery reservoirs (fig. 7) and plastic polypipe (fig. 8) (Terrance E. Holland, U.S. Geological Survey, oral commun., 2011). Tailwater recovery reservoirs store runoff water from irrigation and precipitation from nearby farm fields, and water is recycled into the irrigation system. Polypipe is an efficient method of water application allowing for more accurate and even application of irrigation water. In addition to conservation practices, less water-intensive crops may have been planted or less water used because of higher energy costs, but data for these explanations were not analyzed for this study.

Figure 5. Percentage of water use in 2008 from the alluvial aquifer in eastern Arkansas.
Effect of Groundwater Depletion on Water Use
Although conservation measures have resulted in declines in pumping in Arkansas County since 2000, a large component of the decline in pumping is the result of farmers being unable to pump sufficient water from the alluvial aquifer. Water-level declines have caused reduced saturated thickness in the alluvial aquifer, which translates into reduced transmissivity and ultimately less flow to wells, making groundwater pumping uneconomical and impractical in some areas (Dennis Carman, White River Irrigation District, oral commun., 2011). Using a groundwater-flow model of the alluvial aquifer, saturated thickness in 2010 was calculated by subtracting the altitude of the bottom of the aquifer from the simulated water-level altitude in 2010 (Czarnecki, 2010; Czarnecki and Schrader, 2012). The 2010 simulated saturated thickness in Arkansas County contained many areas that are 20 ft or less; some parts of the alluvial aquifer in Arkansas County were simulated as dry in 2010 (fig. 9).

Figure 6. Groundwater use in Arkansas County, 1965 to 2009.

Figure 9. Simulated saturated thickness for the Mississippi River Valley alluvial aquifer, 2010.

Figure 7. Tailwater recovery reservoir in Prairie County. Photograph by John B. Czarnecki, U.S. Geological Survey.
Long- and Short-Term Water-Level Changes: A Case for Continuous Monitoring
Water-level monitoring is essential for evaluating trends in water levels with time. Water-level declines have been observed in the alluvial aquifer in Arkansas County since at least 1937 (fig. 10). Water-level declines vary with time and location. Continuous water-level data, as exemplified by hydrographs (figs. 11 and 12) from the 25 continuously monitored wells, provide a better understanding of the seasonal and long-term trends in water levels. To assess the trends in these data, linear regression analysis was used to generate regression lines (Czarnecki and Schrader, 2012). This analysis assumes that water-level altitude is dependent only on one variable (time). The slope and y-axis intercept are estimated for each regression line so as to minimize the difference between the observed and predicted water-level altitudes. Despite the seasonal effects, regression lines through the continuous water-level data for periods 2000–6, 2006–8, and 2009–11 show declines (fig. 11). In 2010, water levels appear to have rebounded somewhat, possibly as a result of wetter conditions in 2009 coupled with less groundwater use. Furthermore, the rate of water decline following the wettest year (2009) was only 0.02 ft/yr from 2009 to 2011, compared to a decline of 0.22 ft/yr from 2000 to 2006 and a decline of 0.34 ft/yr from 2006 to 2009.
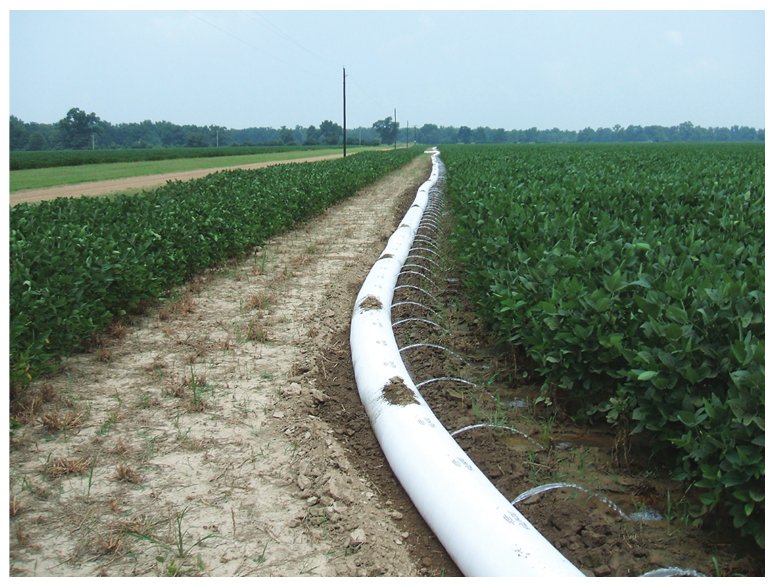
Figure 8. Polypipe used for irrigation of a soybean field. Photograph by Ralf Montanus, U.S. Geological Survey.
As wells produce less water in some areas from the alluvial aquifer, reliance on the deeper Sparta aquifer occurs to make up for some, but not all, of the unmet demand (fig. 6). Although pumping decreased in the alluvial and Sparta aquifers between 2000 and 2005, the decrease in the alluvial aquifer pumping was larger. From 2000 to 2005, pumping in Arkansas County from the alluvial aquifer decreased 86.64 million gallons per day (Mgal/d) compared to a reduction of 60.72 Mgal/d from the Sparta aquifer. However, from 2005 to 2008, pumping from the alluvial aquifer decreased 93.08 Mgal/d compared to an increase in pumping from the Sparta aquifer of 5.02 Mgal/d.

Figure 10. Periodic depth-to-water measurements made in well 04S03W32BCB1 completed in the alluvial aquifer, 1937 to 2010.
Drawdown in the Sparta aquifer has been considerable as indicated by the hydrograph for well 04S05W05ACC1 in Arkansas County (fig. 12). Periodic measurements were made in this well between 1948 and 2005, and during this time water levels dropped about 116 ft. Because the measurements were not sufficiently frequent, seasonal water-level fluctuations could not be observed. Beginning in August 2007, frequent, hourly water-level measurements were recorded in the well and showed that annual changes in water levels generally exceeded 50 ft. Water levels in 2009 (the wettest year on record) fluctuated only 40 ft, compared to 73 ft in 2010 (the 14th driest year on record). Without continuous water-level measurements, a comparison of the effect of wet and dry years on water-level changes would have been less accurate. Although the well is not pumped, it does respond to water-level changes in the Sparta aquifer caused largely by seasonal pumping from irrigation wells located about 1 to 2 miles away. Periodic measurements made in well 04S05W05ACC1 confirm the accuracy of the continuous measurements (fig. 12); however, without the continuous measurements there would have been little incentive to perform the confirmatory, periodic measurements because the cyclic water-level changes caused by seasonal pumping would have gone unobserved. Real-time continuous water-level measurements provide a better representation of the water-level changes occurring within the aquifer, which then can be evaluated in the context of potential causes such as seasonal changes in pumping rates or wetter/drier climatic conditions. In addition, real-time continuous water-level measurements generally are obtained at a reduced cost per measurement compared to periodic measurements made manually and allow for offsite evaluation of measurement equipment and well conditions without having to visit the well site.
Future Water-Level Monitoring
The water-level monitoring network is a vital component for understanding and managing the groundwater resources in Arkansas. Although the program has been effective in providing reliable water-level data, improvements are possible. One such improvement would be to increase the distribution of continuous monitoring wells, particularly in counties with Critical Groundwater Areas (Arkansas Natural Resources Commission, 2011) that pump groundwater from the alluvial or Sparta aquifers. By increasing the distribution of continuous monitoring wells, a better understanding of how quickly water levels in the alluvial and Sparta aquifers respond to climate variability and changes in water use will be possible— particularly the anticipated reductions in groundwater use associated with the Grand Prairie Area Demonstration Project (U.S. Army Corps of Engineers, 2012), which will divert water from the White River to supply irrigation water to Arkansas, Prairie, and Lonoke Counties. As demands on groundwater resources continue, it will be more important to continuously monitor changes in water levels, which will provide water managers with accurate and timely information to help protect these vital resources for future generations.
Summary
Water levels in wells completed in the Mississippi River Valley alluvial aquifer and the Sparta aquifer in eastern Arkansas respond to variability associated with annual precipitation. The wettest year on record in Little Rock, Arkansas, occurred in 2009 with 81.79 inches of precipitation compared to an average of 47.1 inches per year (in/yr). In
References Cited
Arkansas Natural Resources Commission, 2011, The facts about critical ground water designation: Arkansas Natural Resources Commission, accessed February 15, 2012, at http://www.arkansas.gov/awwcc/gw_designation_graphic.pdf.
Czarnecki, J.B., 2010, Groundwater-flow assessment of the Mississippi River Valley alluvial aquifer of northeastern Arkansas: U.S. Geological Survey Scientific Investigations Report 2010–5210, 33 p.
Czarnecki, J.B., and Schrader, T.P., 2012, Effects of recent climate variability on groundwater levels in eastern Arkansas: U.S. Geological Survey Scientific Investigations Report 2012–5258, 17 p.
National Oceanic and Atmospheric Administration, 2011, NOAA: 2010 Tied For Warmest Year on Record, accessed February 15, 2012, at http://www.noaanews.noaa.gov/stories2011/20110112_globalstats.html.
National Weather Service, 2011, Climate statistics for the Little Rock area: National Weather Service, accessed January 11, 2011, at http://www.srh.noaa.gov/images/lzk/pdf/clilit.pdf.
contrast, 2005 and 2010 were the 7th and 14th driest years on record with 34.55 and 36.52 in/yr, respectively. This variability in precipitation was reflected in water-level altitude changes between 2004 and 2008 and 2006 and 2010. Generally, drier conditions between 2004 and 2008 led to an average decline in water levels in eastern Arkansas of 1.62 feet (ft), whereas wetter conditions between 2006 and 2010 led to an average rise in water levels of 1.38 ft. Drier periods likely result in less recharge compared to wetter periods. Groundwater use from the alluvial aquifer peaked in 2000 and has been on the decline, in part, because of conservation measures and substantial reduction in aquifer saturated thickness.
Groundwater-flow model results show that some areas of the alluvial aquifer simulated as dry in 2010, resulting in reduced capacity of the alluvial aquifer to produce water in those areas. Periodic and real-time continuous water-level data show substantial changes in the alluvial and Sparta aquifers. However, real-time continuous water-level measurements allow for a more complete and accurate assessment of water-level changes resulting from the effect of variability in precipitation and water use than do periodic water-level measurements.
National Weather Service, 2012, Little Rock yearly climate summary (2009): National Weather Service, accessed January 19, 2012, at http://www.srh.noaa.gov/lzk/?n=2009.htm.
Schrader, T.P., 2010, Water levels and selected water-quality conditions in the Mississippi River Valley alluvial aquifer in eastern Arkansas, 2008: U.S. Geological Survey Scientific Investigations Report 2010–5140, 71 p., 2 plates.
U.S. Army Corps of Engineers, 2012, Grand Prairie area demonstration project: U.S. Army Corps of Engineers, Memphis District, accessed January 25, 2012, at http://www.mvm.usace.army.mil/grandprairie/overview/default.asp.
U.S. Geological Survey, 2011, Groundwater watch: Arkansas County, Arkansas: U.S. Geological Survey, accessed April 28, 2011, at http://groundwaterwatch.usgs.gov/countymaps/AR_117.html.
U.S. Geological Survey, 2012, Aggregate Water-Use Data System (AWUDS) of USGS, accessed February 15, 2012, at http://water.usgs.gov/watuse/wuawuds.html.
—John B. Czarnecki and T.P. Schrader
Where this page came from
This page was imported from U.S. Geological Survey. Published by the U.S. Geological Survey and, as a work of the United States government, in the public domain.
Nobody has written it yet — it is the source material at a new address, which is why search engines are asked to skip it and why no one earns from it. It is up for grabs: take it on, and it is yours to rewrite and to earn from.
ライセンス: CC0 1.0(パブリックドメイン) · 出典 pubs.usgs.gov
1
0
0
0

コメント


