Get tips and tricks on how to access, visualize and use Census Bureau data. The Census Academy team of data experts these Data Gems.
Prevalence Maps
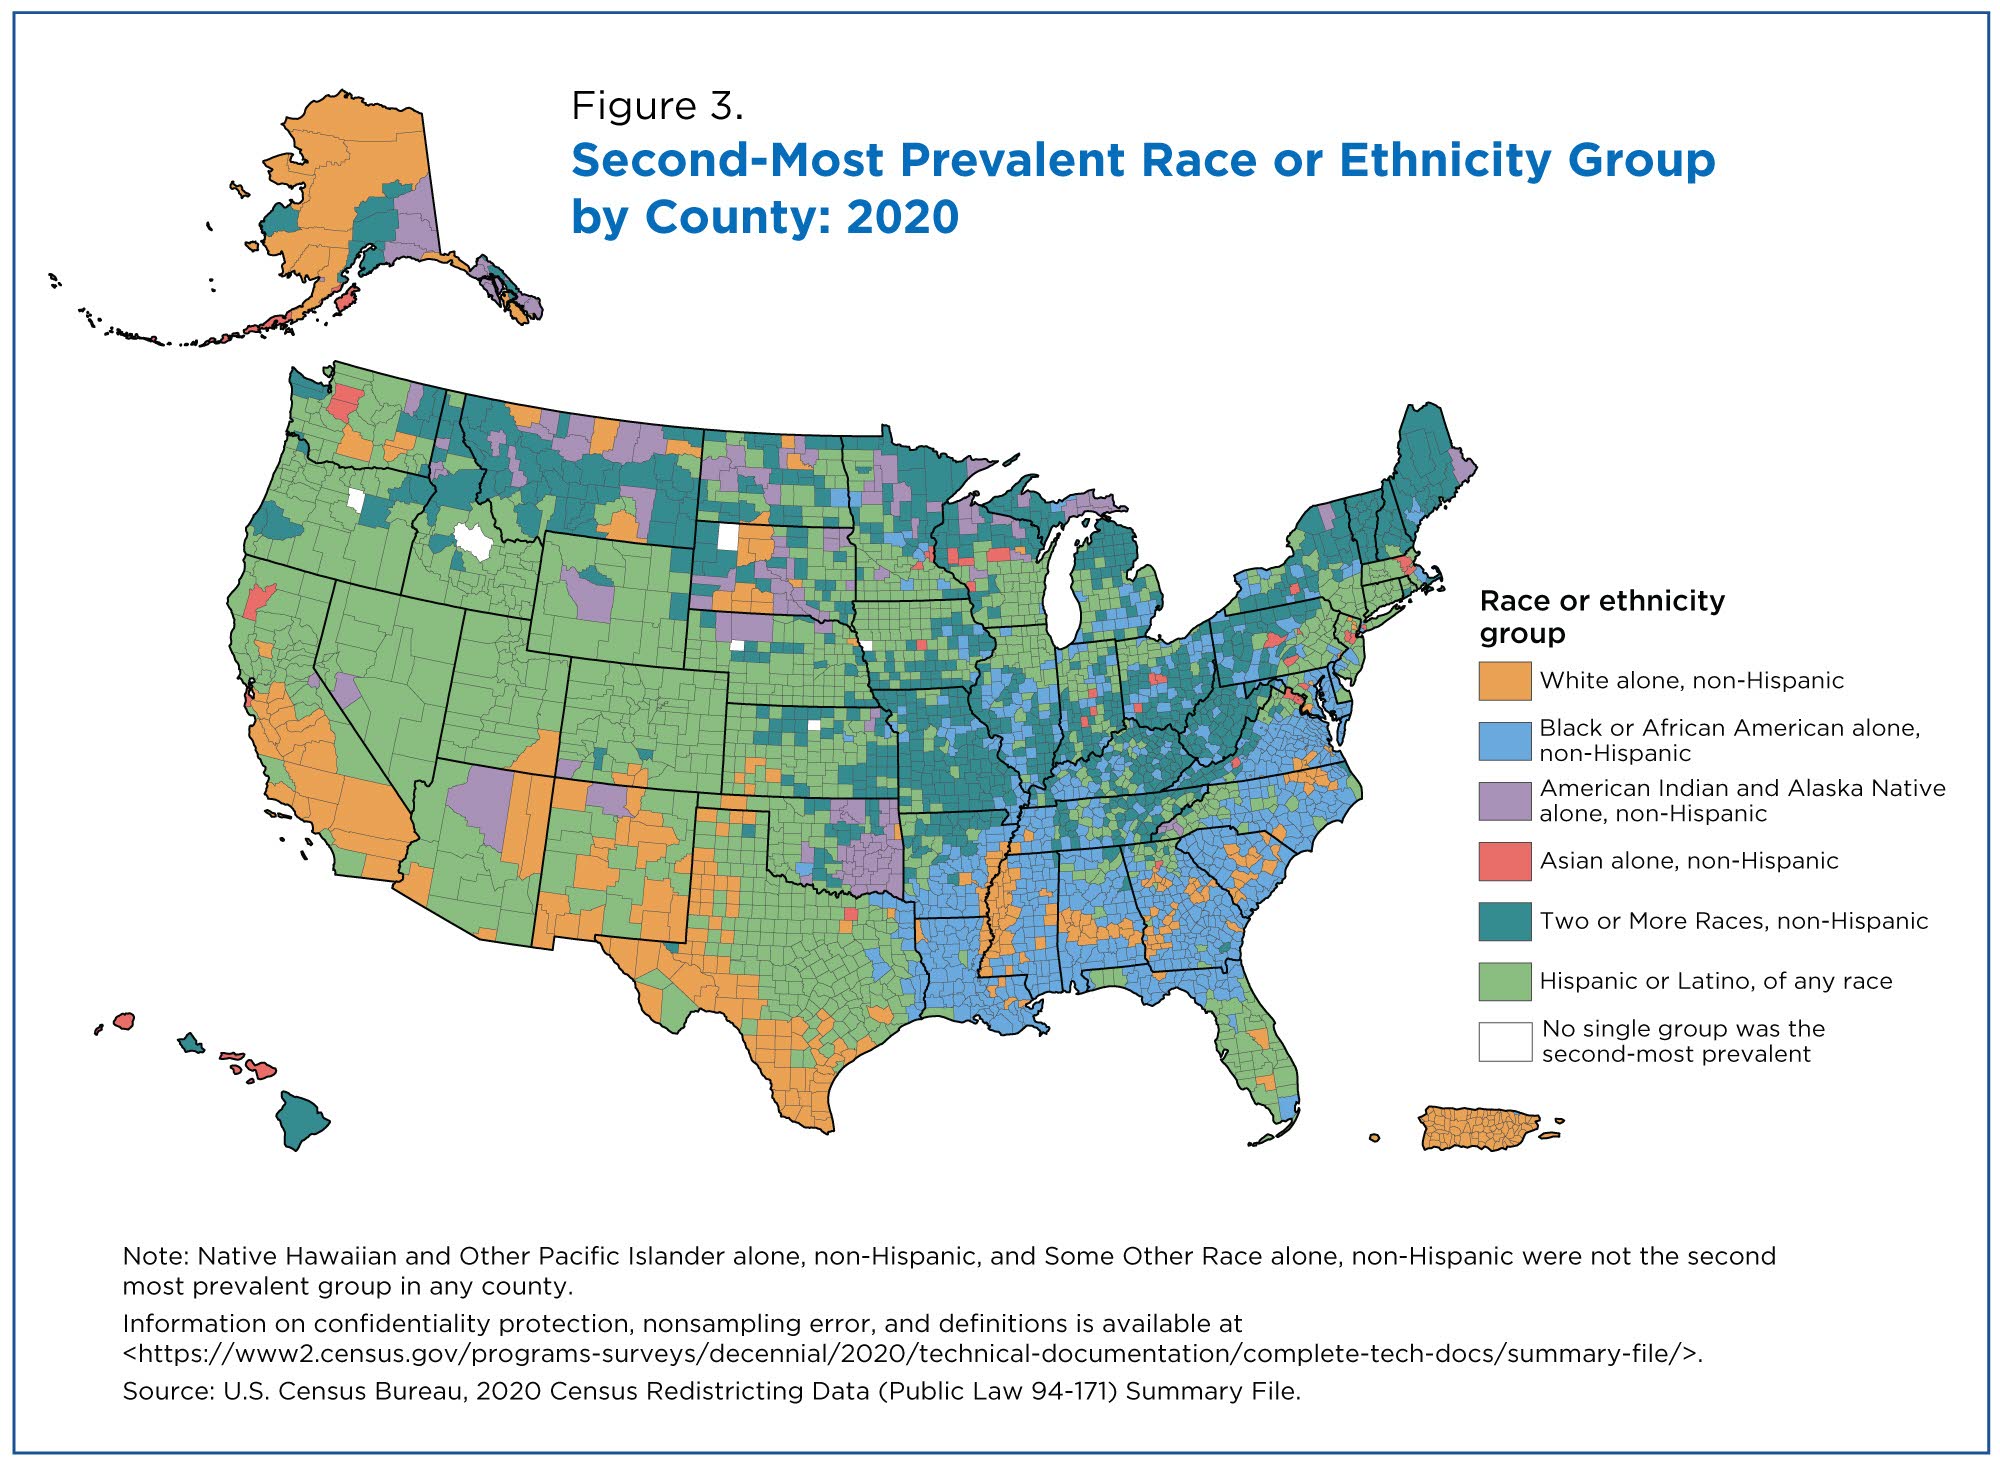
Figures 2 and 3 show the most and second-most prevalent racial or ethnic groups by county in 2020.
The White alone non-Hispanic population was the largest — or most prevalent — racial or ethnic group for most counties in the United States.
However, other racial or ethnic groups were the most prevalent in certain parts of the country:
- Black or African American alone non-Hispanic population in parts of the South.
- Hispanic or Latino population in the Southwest and West.
- American Indian and Alaska Native alone non-Hispanic population in parts of Alaska and the Southwest and Midwest where there are tribal lands.
There is more variation in the map for the second-most prevalent racial or ethnic group. More racial or ethnic groups are represented and the patterns are not as tightly clustered in specific regions.
Often, these show an inverse relationship to the most prevalent group map.
- The presence of the Hispanic or Latino population as the second-most prevalent group spanned the entire continental United States, with large numbers of counties in every region.
- The Multiracial non-Hispanic population was the second-most prevalent group in many counties throughout the northern part of the country as well as Alaska and Hawaii.
- Counties where the Black or African American alone non-Hispanic population was the second-most prevalent group are mostly concentrated in the South; it was also the second-most prevalent group in parts of the Northeast and Midwest. This is similar to patterns we observed in the 2010 Census.
- Counties where the American Indian and Alaska Native alone non-Hispanic population was the second-most prevalent are clustered in states that traditionally have large American Indian and Alaska Native populations, such as Oklahoma, Alaska, North Dakota and South Dakota.
- The White alone non-Hispanic population was the second-most prevalent group in parts of the South and the West.
- Following a similar pattern as in 2010, the Asian alone non-Hispanic population was the second-most prevalent group in several counties throughout the Northeast, West, Alaska and Hawaii.
- The Native Hawaiian and Other Pacific Islander alone non-Hispanic population and the Some Other Race alone non-Hispanic population were not the second-most prevalent group in any state, county or region.
You can explore the 2020 Census prevalence maps in detail at the county level and compare them to the patterns in 2010 using the “Racial and Ethnic Diversity in the United States: 2010 Census and 2020 Census” data visualization.
These multiple measures of diversity complement the 2020 Census redistricting data release and enable us to explore the richness and complexity of our nation’s population in a new light.
Related Information
For more information on how the Census Bureau collects, codes and tabulates statistics on Hispanic or Latino origin and race, explore our 2020 Census subject definitions pages and the 2020 Census Redistricting Technical Documentation.
Information on the application of differential privacy and data accuracy for the 2020 Census at various levels of geography are available on 2020 Census Data Products: Disclosure Avoidance Modernization website.****
All the authors are in the Census Bureau’s Population Division:
Eric Jensen is the senior technical expert for Demographic Analysis.
Nicholas Jones is the director and senior advisor for Race and Ethnicity Research and Outreach.
Megan Rabe is a demographic statistician for Sex and Age Statistics.
Beverly Pratt is a demographic statistician for Race and Ethnicity Research and Outreach.
Lauren Medina is a demographic statistician for Population Statistics.
Kimberly Orozco is a demographic statistician for Population Statistics.
Lindsay Spell is a geographer in the Population Geography Staff.
Where this page came from
This page was imported from U.S. Census Bureau. Published by the U.S. Census Bureau and, as a work of the United States government, in the public domain; material credited to others is left out.
Nobody has written it yet — it is the source material at a new address, which is why search engines are asked to skip it and why no one earns from it. It is up for grabs: take it on, and it is yours to rewrite and to earn from.
ライセンス: CC0 1.0(パブリックドメイン) · 出典 www.census.gov
1
0
0
0

コメント