
How satisfied are Americans with their lives? The 2022 National Health Interview Survey asked adults: "In general, how satisfied are you with your life?" — very satisfied, satisfied, dissatisfied or very dissatisfied.
Results
| Answer | All adults | Without disabilities | With disabilities |
|---|---|---|---|
| Very satisfied | 44.6% | 46.8% | 20.5% |
| Satisfied | 51.3% | 50.3% | 61.2% |
| Dissatisfied | 3.3% | 2.4% | 14.2% |
| Very dissatisfied | 0.8% | 0.5% | 4.1% |
Percentages are age-adjusted.
- Most adults in both groups were satisfied or very satisfied.
- Adults without disabilities were more likely than those with disabilities to be very satisfied.
- Adults with disabilities were more likely to be satisfied, dissatisfied or very dissatisfied — and far less likely to be very satisfied.
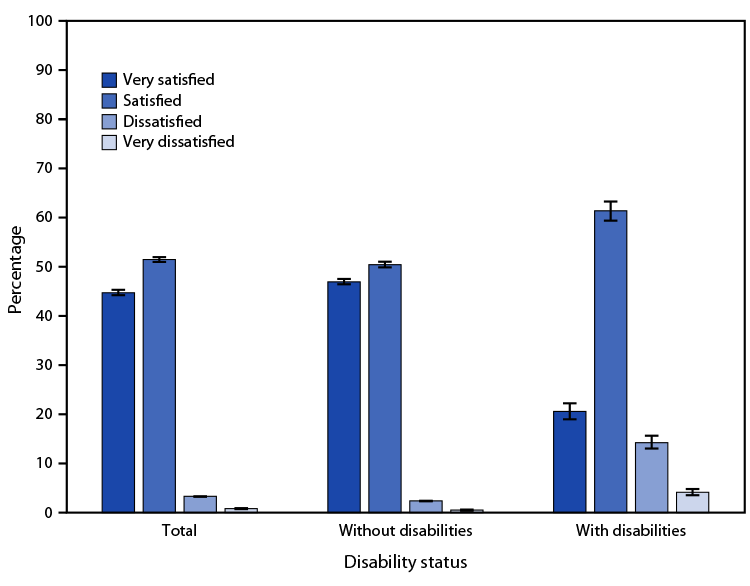
Life satisfaction among U.S. adults by disability status, 2022. From CDC's MMWR.
How disability was defined
Adults were counted as having a disability if they reported "a lot of difficulty" or "cannot do at all" in at least one of six areas:
- seeing, even with glasses;
- hearing, even with hearing aids;
- walking or climbing stairs;
- communicating (understanding or being understood);
- remembering or concentrating;
- self-care, such as washing or dressing.
The survey is based on household interviews with a sample of the U.S. civilian, noninstitutionalized population. Percentages were age-adjusted to the 2000 U.S. standard population.
Sources
Based on "QuickStats: Age-Adjusted Percentage of Adults Aged ≥18 Years Who Reported Their Level of Satisfaction with Life, by Disability Status — National Health Interview Survey, United States, 2022," reported by Julie D. Weeks, Jennifer H. Madans and Nazik Elgaddal, Morbidity and Mortality Weekly Report 72(51), CDC; a work of the United States government in the public domain.
이용 허락: CC0 1.0 (퍼블릭 도메인) · 출처 www.cdc.gov
1
0
0
0

코멘트


