
I ntrodudion
Flowing bodies of water such as streams ,have the inherent ability to assimilate organic pollution from domestic and industrial waste-water discharges, from agricultural runoff, and from VB!rious natural sources. The sanitary engineer and the hydrologist are searching for ways to define the ability of a water body to assimilate waste, the proportion of capacity being used at present, and the indices by which the capacity can be measured. One of these indices is dissolved oxygen, the fuel required for destroying organic waste. Although there are other factors-such as the amount of dissolved solids present, temperature, suspended sediment, biological organisms, and the amount of flow-the amount of dissolved oxygen is a -q.seful measure of the capacity of streams to assimilate waste.
When polluted water is exposed to the air, oxygen is absorbed to replace that consumed in the. slow combustion of the organic matter. This proc~ss of reoxygenation, or reaeration, goes on at a rate that is proportional to the deficit of oxygen-that is, the difference between the amount of oxygen the stream can hold at a given temperature and the actual content.
The Coefficient of Reaeration
The rate of absorption of oxygen per unit of time is often expressed by the simple equation,
The oxygenation of a stream is a function of the biologic, physical, and hydraulic properties of the stream. Oxygen may be added by such processes as photosynthesis of aquatic vegetation and by mechanical aeration of the flowing water. Oxygen may be removed by such processes as vegetal decay and plant respiration, as well as by the oxidation of pollutants. In flowing streams mechanical aeration may be the dominant factor.
The ·effect of hydraulic properties of rivers on the coefficient of reaeration is usually expressed as the coefficient of reaeration, k 2 • There are available a few measurements of the coefficient of reaeration that indicate a rough sort of relation with the mean velocity, v, and depth, H. Two sets of river data and two sets of laboratory results plotted in terms ofv/H1.ss are shown in figure 1.
This ratio seems to accommodate both the river and the laboratory data referenced and graphed in figure 1, which suggest that k 2 = 3.3vI nus.
The correspondence shown in figure 1 is evidence that velocity and stream depth are highly significant factors, although measurements of these factors alone are incomplete estimators of reaeration. Other hydraulic properties, such as the occurrence of pools and riffles and the degree of meandering, also affect the rate of reaeration.
Other relations have been prepared but none for t"l\e set of available data in this simple form. The empirical nature of the formula (fig. 1) limits its application to the range of data on which it is based; fortunately, the range happens to be fairly large.
Other Influences on the Reaeration of Streams
In general, mechanical reaeration is probably a dominant factor in shallow, swift streams. In deep, sluggish estuaries and lakes, dissolved oxygen is a product of photosynthesis of phytoplankton and benthic flora (floating and bottom plant life).
Water temperature affects the reaeration coefficient such that it is somewhat greater in warm waters than in cold waters. In normal practice a temperature correction is applied to the basic equation. (A 1°F [0.55°C] change modifies the reaeration coefficient by about 1 percent.) However, since this paper is concerned with the influence of the hydraulic properties, all coefficients are corrected to a common base of 68°F (20°C).
The reaeration coefficient is also affected, usually in an adverse direction, by a pollution load, including sediment, that alters the physical and chemical properties of the stream.
To sum up, the reaeration coefficient of a stream is a property of its velocity and depth, and many pertinent data are available in the records of the U.S. Geological Survey to. examine the extent and nature of the variations in this coefficient.
Downstream Variations

Regional Variations at Mean Flow
The different geomorphic character of rivers is reflected in their reaeration coefficients when the

data are compared in graphs similar to figure 2. Figure 3 shows a substantial contrast between the streams of the Coastal Plain and those of the basins of the Bighorn and Powder Rivers in the Northern Rocky Mountains region. According to inferences from river depths and velocities, the reaeration coefficient, k2, varies as 15/VQ (where Q is mean discharge, in cubic feet per second) in the Coastal Plain and as 80/VQ in the Northern Rocky Mountains region; other regions have values in between. For example, the imputed values of the reaeration coefficient in the Appalachian Plateaus region are given by 50/VQ. A look at the regional variations suggests that river slopes are the dominant factor and point to the obvious but perverse fact that the streams of the populated areas-those of lesser slopes-have reaeration capacities that are low relative to their rates of discharge.
The values of the coefficient of reaeration for smaller rivers derived from this formula seem to exceed those customarily used in engineering practice. There may be valid reasons for the aeration values of polluted streams to be less than the values projected from experimental data. The answer is that more field data are needed.
The textbook classification of rivers for estimation of the reaeration properties does not seem to be consistent with their geomorphic properties or the factors suggested by the formula. For example, in the guide that is commonly reported in the literature (Linsley and Franzini, 1955, p. 502), values are given for "sluggish streams" and "swift streams," and for "large streams." However, depth is a more significant parameter than velocity, and "swift" streams shown as having large values of the coefficient of reaeration are usually large streams which, in turn, are deep and should therefore have low values of the coefficient.
Local Variations
As a river rises in response to an increase in discharge, it increases its depth and velocity, a condition causing the reaeration coefficient to decrease. In general, rivers increase in depth and velocity at about the 0.4 power of the discharge. Hence, at any given location, the coefficient of reaeration decreases at about the 0.13 power of the discharge.
These are general averages. On alluvial streams with shifting beds, the coefficient of reaeration changes in rather complex ways. For example, over a period of several years, the depths and velocities of the Kansas River, as measured at a given section at Bonner Springs, Kans., changed in the following way:
Low water ~pool) .......... ··········· 2.5
At low water the reaeration coefficient ranged between 0.13 and 4.1; the range is somewhat less at mean flow, whereas at bankfull the reaeration coefficient centered about 0.43. It must be noted that these changes in depths and velocities were measured at a given section. Considering the river as a whole, it is possible that the changes at one section may be compensated by changes in the opposite direction at another section.
In many rivers the water flow is alternately through shallows and deeps-or riffles and pools, as they are often called. The contrast between riffles and pools is especially marked at low water; when the river reaches bankfull, these features are said to be "drowned out." Figure 4 shows the
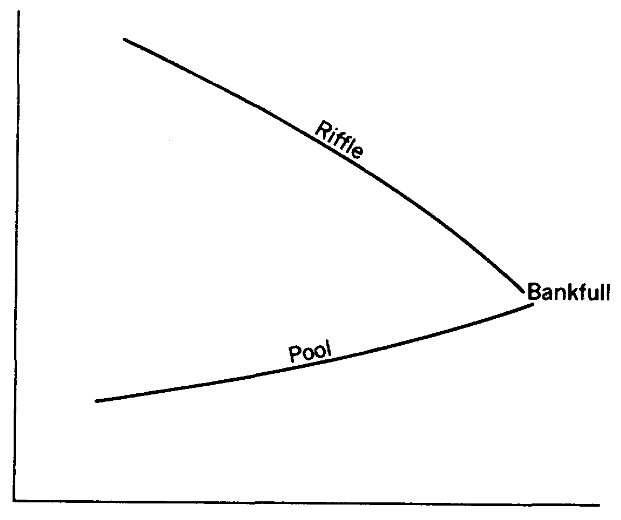
DISCHARGE ---~ FIGURE 4.-Schematic variation in reaerotion coefficient in pools and riffles.
...UJ0
schematic variation of the coefficient of reaeration with discharge. The relations between velocity and depths in these reaches are such that the reaeration coefficient increases slowly with increasing stage in the pool, but it decreases rapidly in the riffle.
The general trend of the coefficient of reaeration is downward with increasing stage, as remarked
before; but since rapid aeration at riffles is at the expense of lesser aeration in the pools, it is less evident whether the pool and riffle combination is more or less efficient than a relatively uniform channel might be.
Distribution of Assimilative Capacity
The coefficients of reaeration are those calculated by the formula given previously, and the assimilative capacity for each stream of given order has been computed by the formula given in the footnote of table 2. The values in the column for total assimilative capacity refer to the total load, in tons of oxygen per day, at mean flow that could be absorbed from the air by the river system for each unit (part per million) of oxygen less than the saturation value. This follows the original premise in the paper that reaeration occurs at a rate that is proportional to the deficit of oxygen.
One could compute similar values for, say, average low flow for the systems (lower 25-percent quartile) when oxygen levels are minimized if the hydraulic characteristics of the channel are known. However, the main purpose of the computations is to give some order of magnitude of the capacity of the stream for "reconditioning" itself when oxygen-consuming substances are encountered. The computations presuppose a synoptic condition, an unlikely situation in any total river system which is subject to the vagaries of nature and whose regimen is undergoing continuous change by man.
The results, as shown in the column for assimilative capacity, indicate that, although the total assimilative capacity among the several orders is roughly of corresponding magnitude, most of the assimilative capacity occurs in streams of the sixth and seventh orders, not the largest or the smallest.
The above discussion on hydraulic factors helps to explain why large streams that might be sources of copious supply are not equally effective in disposing of wastes through self-purification. Because population growth tends to develop around large rivers or bodies of water, cities in the lower reaches of a basin are inherently at some disadvantage in view of the relatively low natural assimilative
capacity of their adjacent streams. Of course, in the final analysis, the extent of waste loading in relation to total oxygen available at any given time is the balancing factor.
Summary
As the river rises in response to a change in discharge, depth and velocity change also, and the reaeration coefficient decreases at about the 0.13 power of the discharge. Where river flow is alternately through shallows and deeps, k2 increases slowly with increasing stage in the pool, but it decreases abruptly in the riffle. By use of the formula k2QL/v to give the dimension of weight of oxygen per unit time, computations are made for the total load, in tons of oxygen per day at mean flow, that could be absorbed from the air by the river system for each unit of oxygen less than saturation value. Most of the assimilative capacity occurs in streams of the sixth and seven order, not in the largest or the smallest.
The above discussion 'of hydraulic factors helps to explain why cities in the lower reaches of a basin are inherently at some disadvantage in view of the relatively low natural assimilative capacity of their adjacent streams.
Where this page came from
This page was imported from U.S. Geological Survey. Published by the U.S. Geological Survey and, as a work of the United States government, in the public domain.
Nobody has written it yet — it is the source material at a new address, which is why search engines are asked to skip it and why no one earns from it. It is up for grabs: take it on, and it is yours to rewrite and to earn from.
이용 허락: CC0 1.0 (퍼블릭 도메인) · 출처 pubs.usgs.gov
1
0
0
0

코멘트


