Download Image Download Image of heatmap over the US
This data visualization shows the maximum wind gusts from Hurricane Irma from September 7 to September 10, 2017. Note how the strongest wind gusts are on the north side of the storm track (the faint dotted line). According to the NOAA's National Hurricane Center, Irma's maximum sustained winds ranged from 110 (on 9/10) to near 180 (on 9/7) miles per hour during this period. This graphic was created with data from the RTMA, which uses surface observation data to create a highly accurate gridded analysis of past weather conditions. The data covers only the Continental United States and coastal areas, so areas of the storm further to the south and east, where Irma was at maximum intensity, are not visible
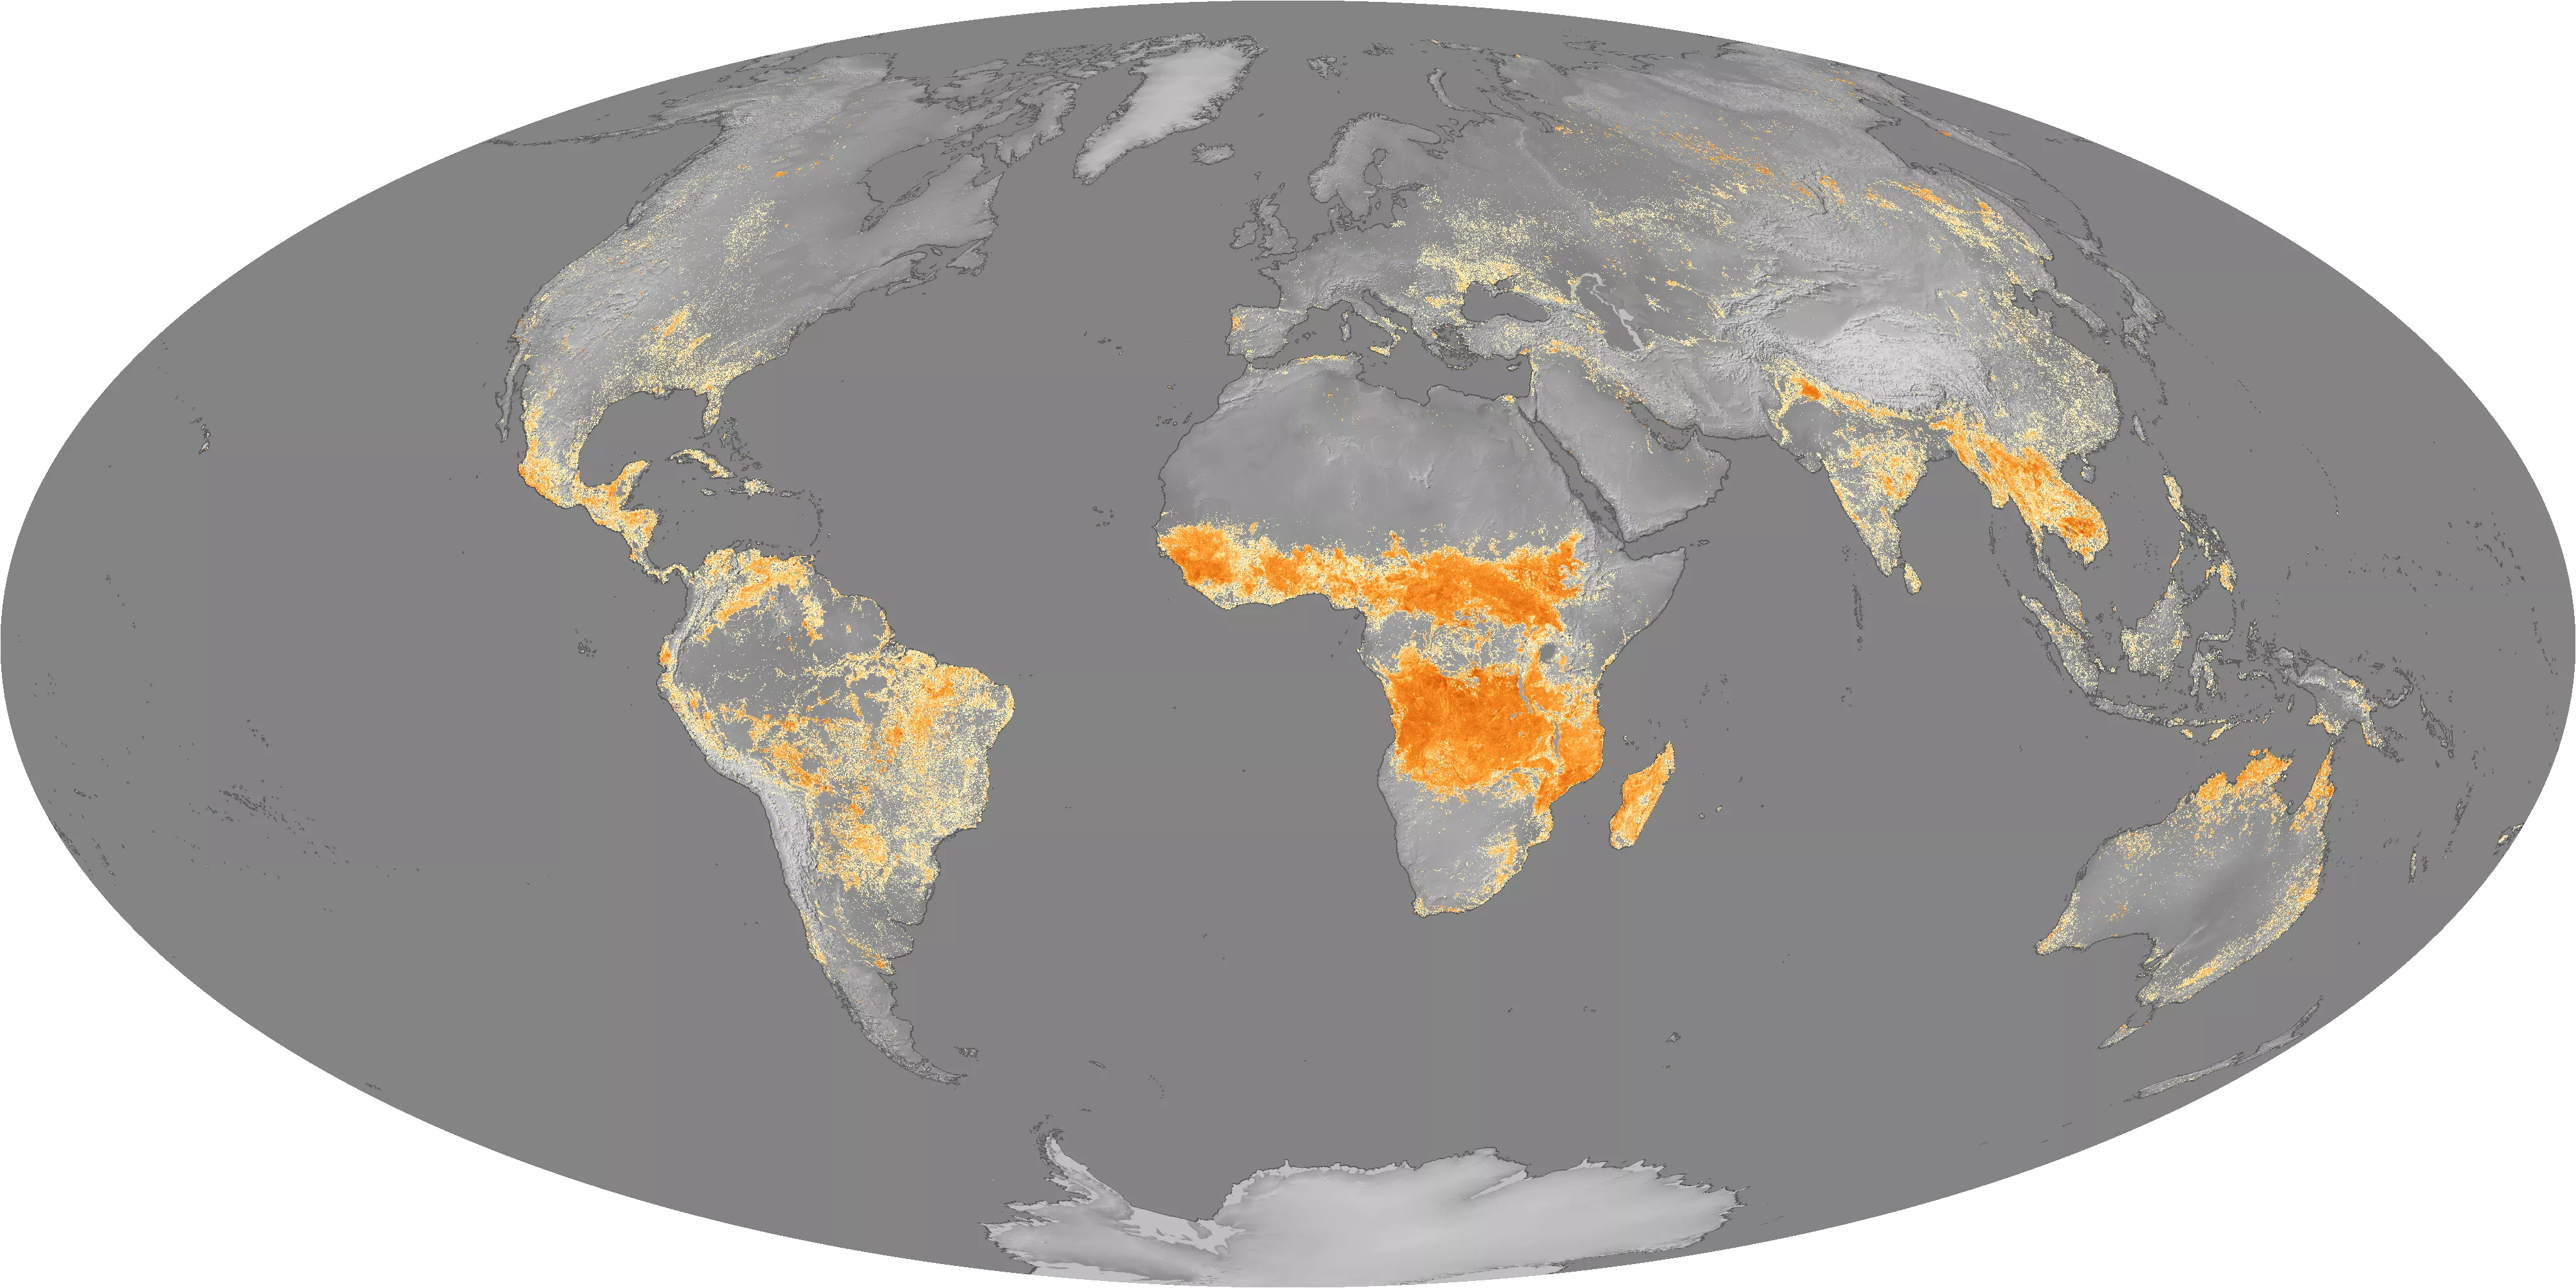
NOAA satellites, including GOES and JPSS, are highly sensitive to differences in thermal radiation (i.e., the heat released into space). Areas with very high thermal signatures, called hot spots, are indicative of active fire areas. This map plots all of the thermal hot spots detected by JPSS’s VIIRS sensor over a one-year period. Areas with the highest frequency of hot spots are associated with agricultural burning, deforestation, and wildfires.
This data visualization shows the maximum wind gusts from Hurricane Irma from September 7 to September 10, 2017. Note how the strongest wind gusts are on the north side of the storm track (the faint dotted line). According to the NOAA's National Hurricane Center, Irma's maximum sustained winds ranged from 110 (on 9/10) to near 180 (on 9/7) miles per hour during this period. This graphic was created with data from the RTMA, which uses surface observation data to create a highly accurate gridded analysis of past weather conditions. The data covers only the Continental United States and coastal areas, so areas of the storm further to the south and east, where Irma was at maximum intensity, are not visible
Where this page came from
This page was imported from NOAA Satellites (NESDIS). Published by NOAA's National Environmental Satellite, Data, and Information Service and, as a work of the United States government, in the public domain; pictures credited elsewhere are left out.
Nobody has written it yet — it is the source material at a new address, which is why search engines are asked to skip it and why no one earns from it. It is up for grabs: take it on, and it is yours to rewrite and to earn from.
Licence: CC0 1.0 (public domain) · Adapted from www.nesdis.noaa.gov
1
0
0
0

Comments