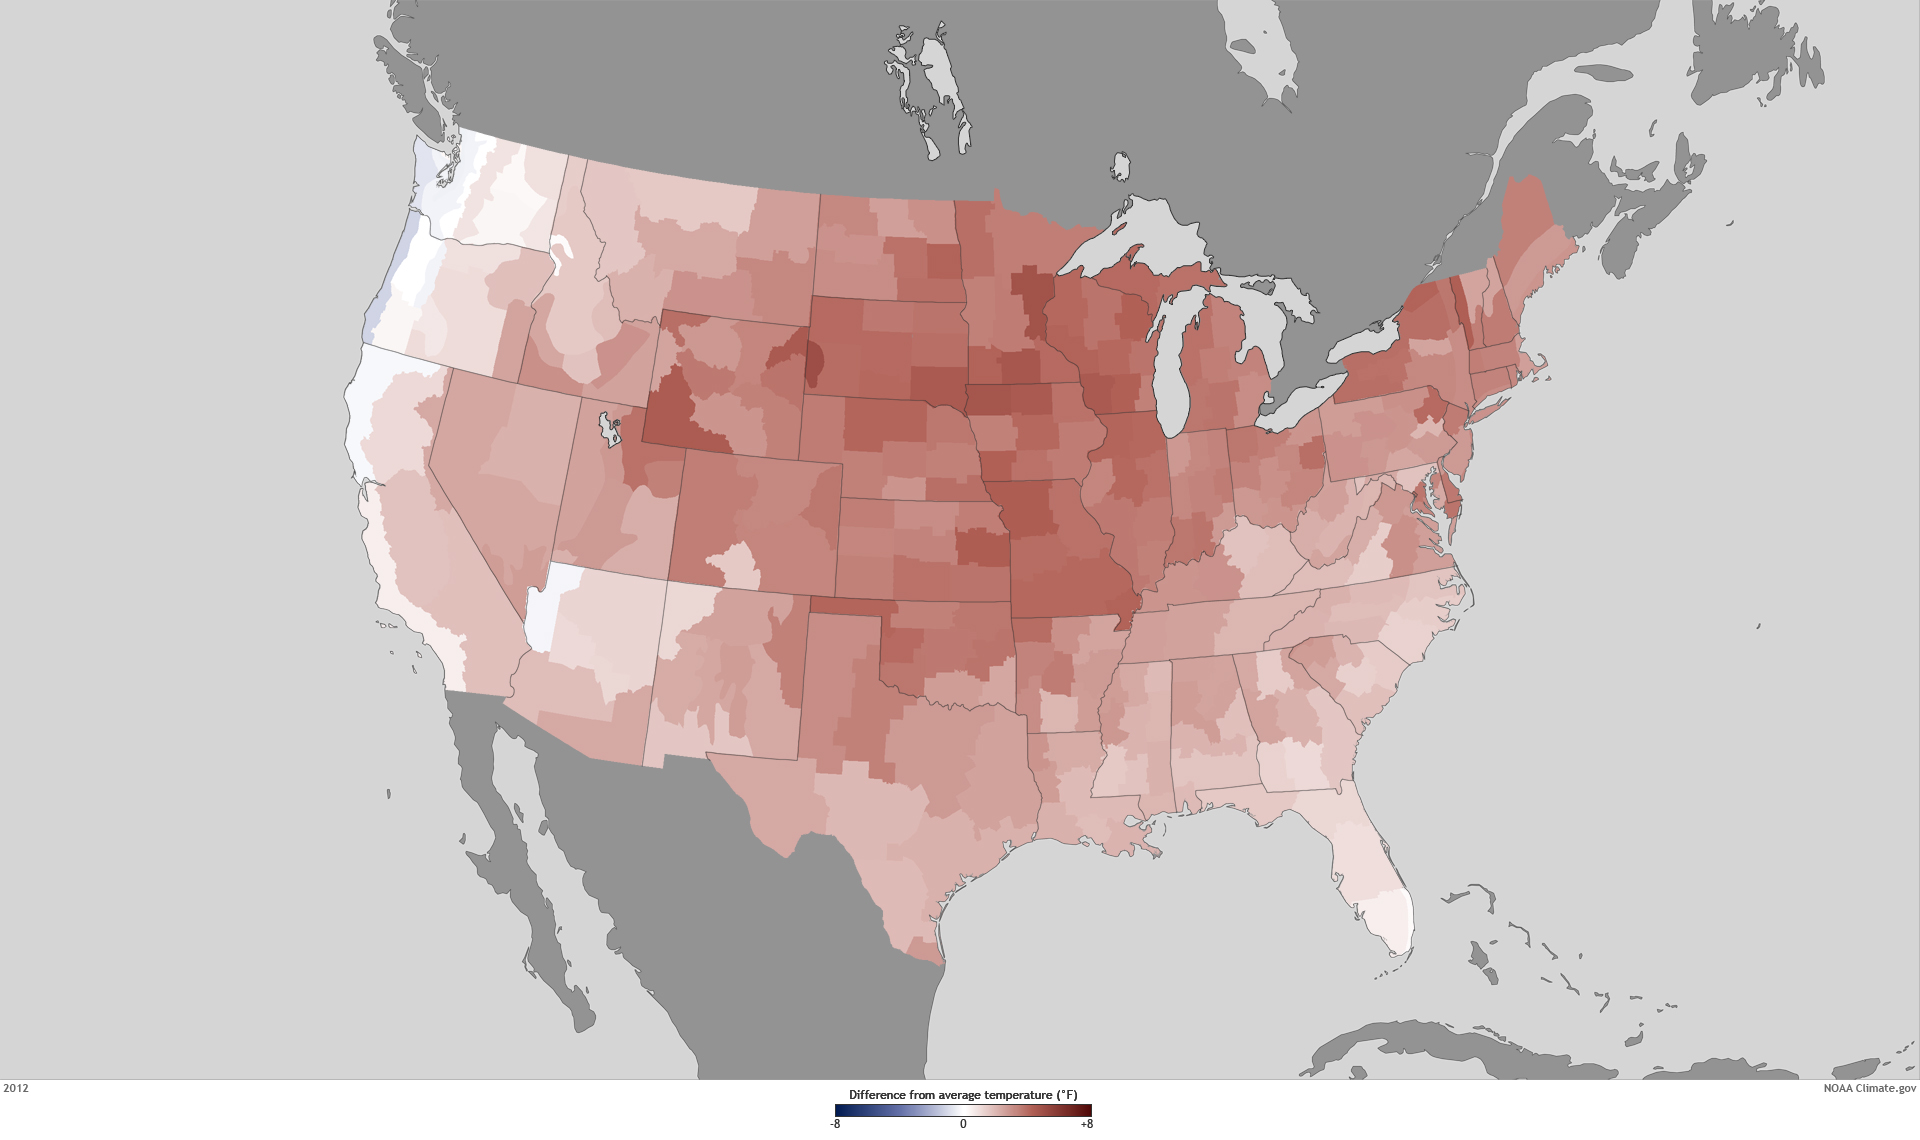
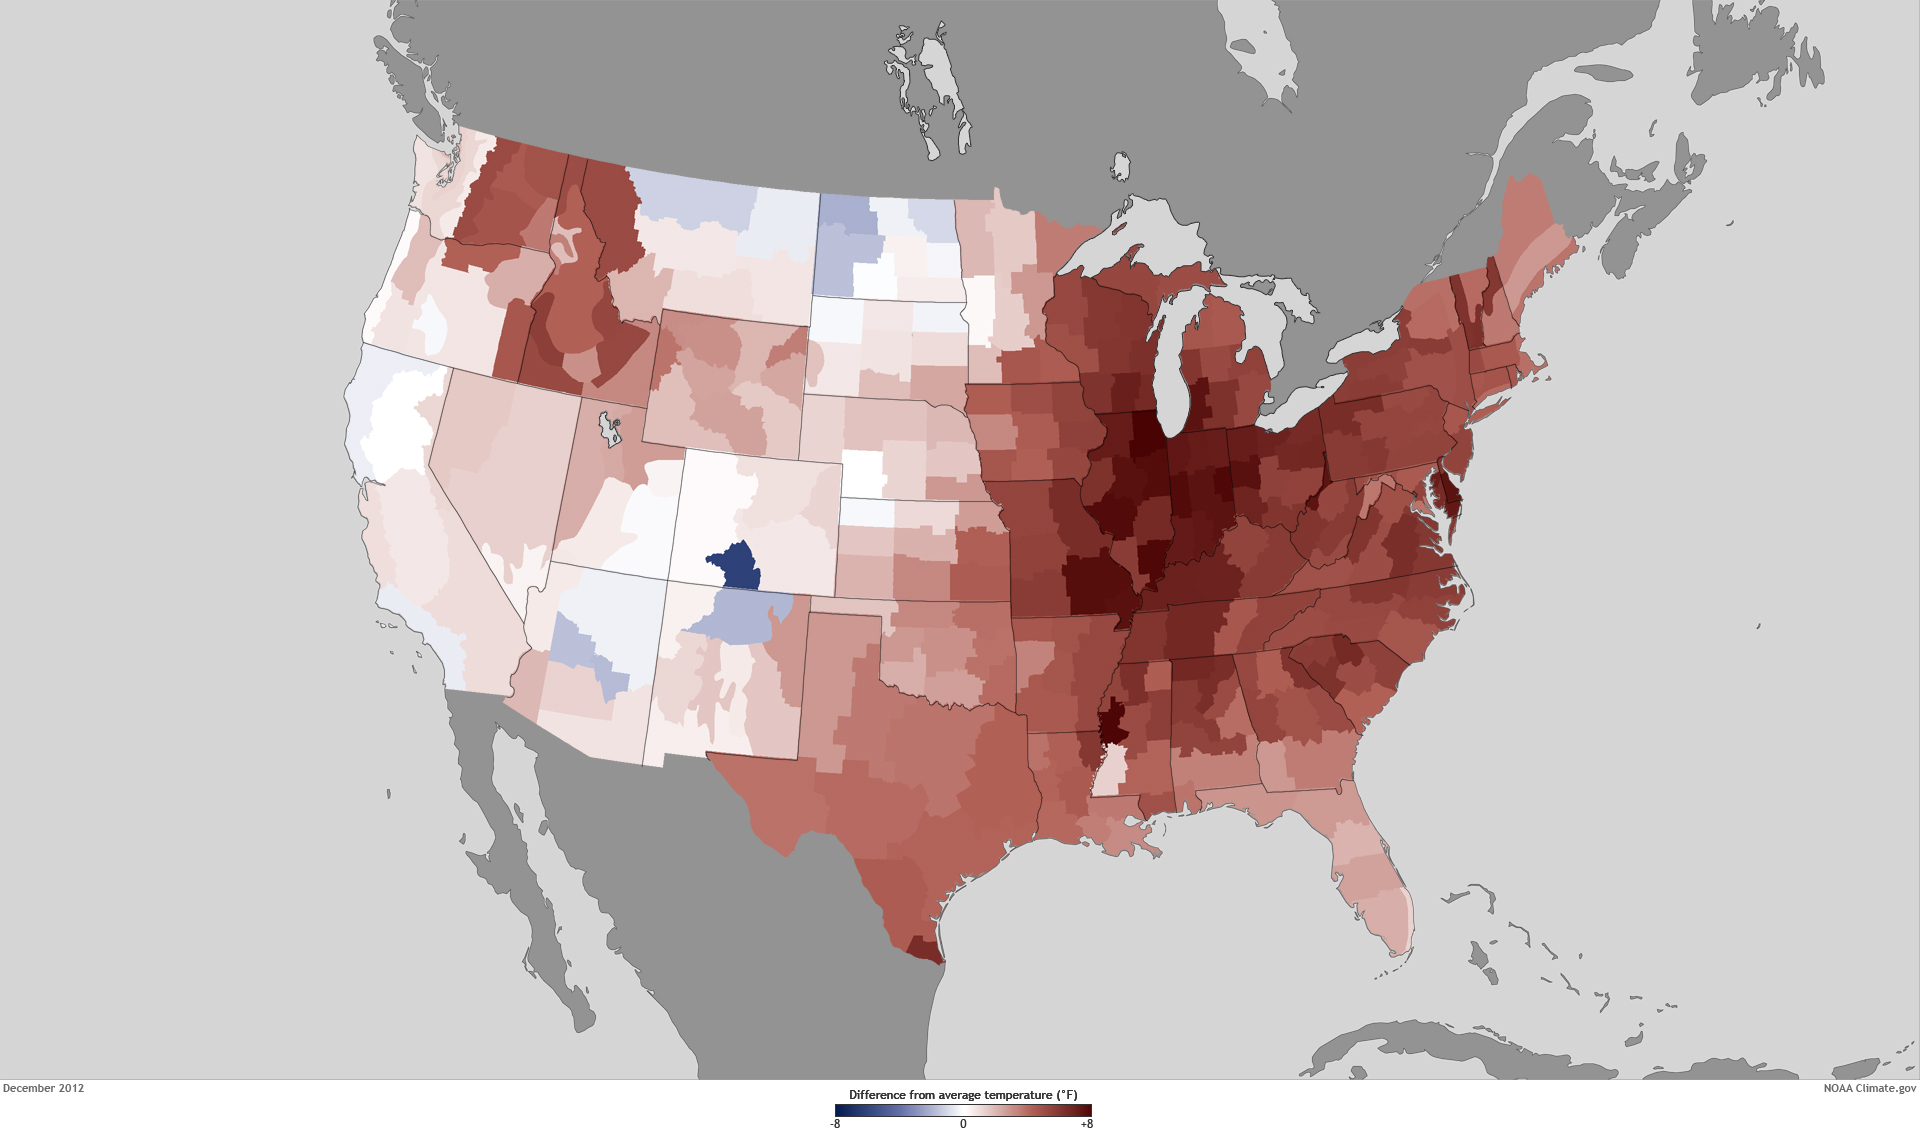
According to the latest statisticsfrom NOAA’s National Climatic Data Center, the average temperature for the contiguous United States for 2012 was 55.3° Fahrenheit, which was 3.2° Fahrenheit above the twentieth-century average and 1.0° Fahrenheit above the previous record from 1998. The year consisted of the fourth-warmest winter, a record-warm spring, the second-warmest summer, and a warmer-than-average autumn.

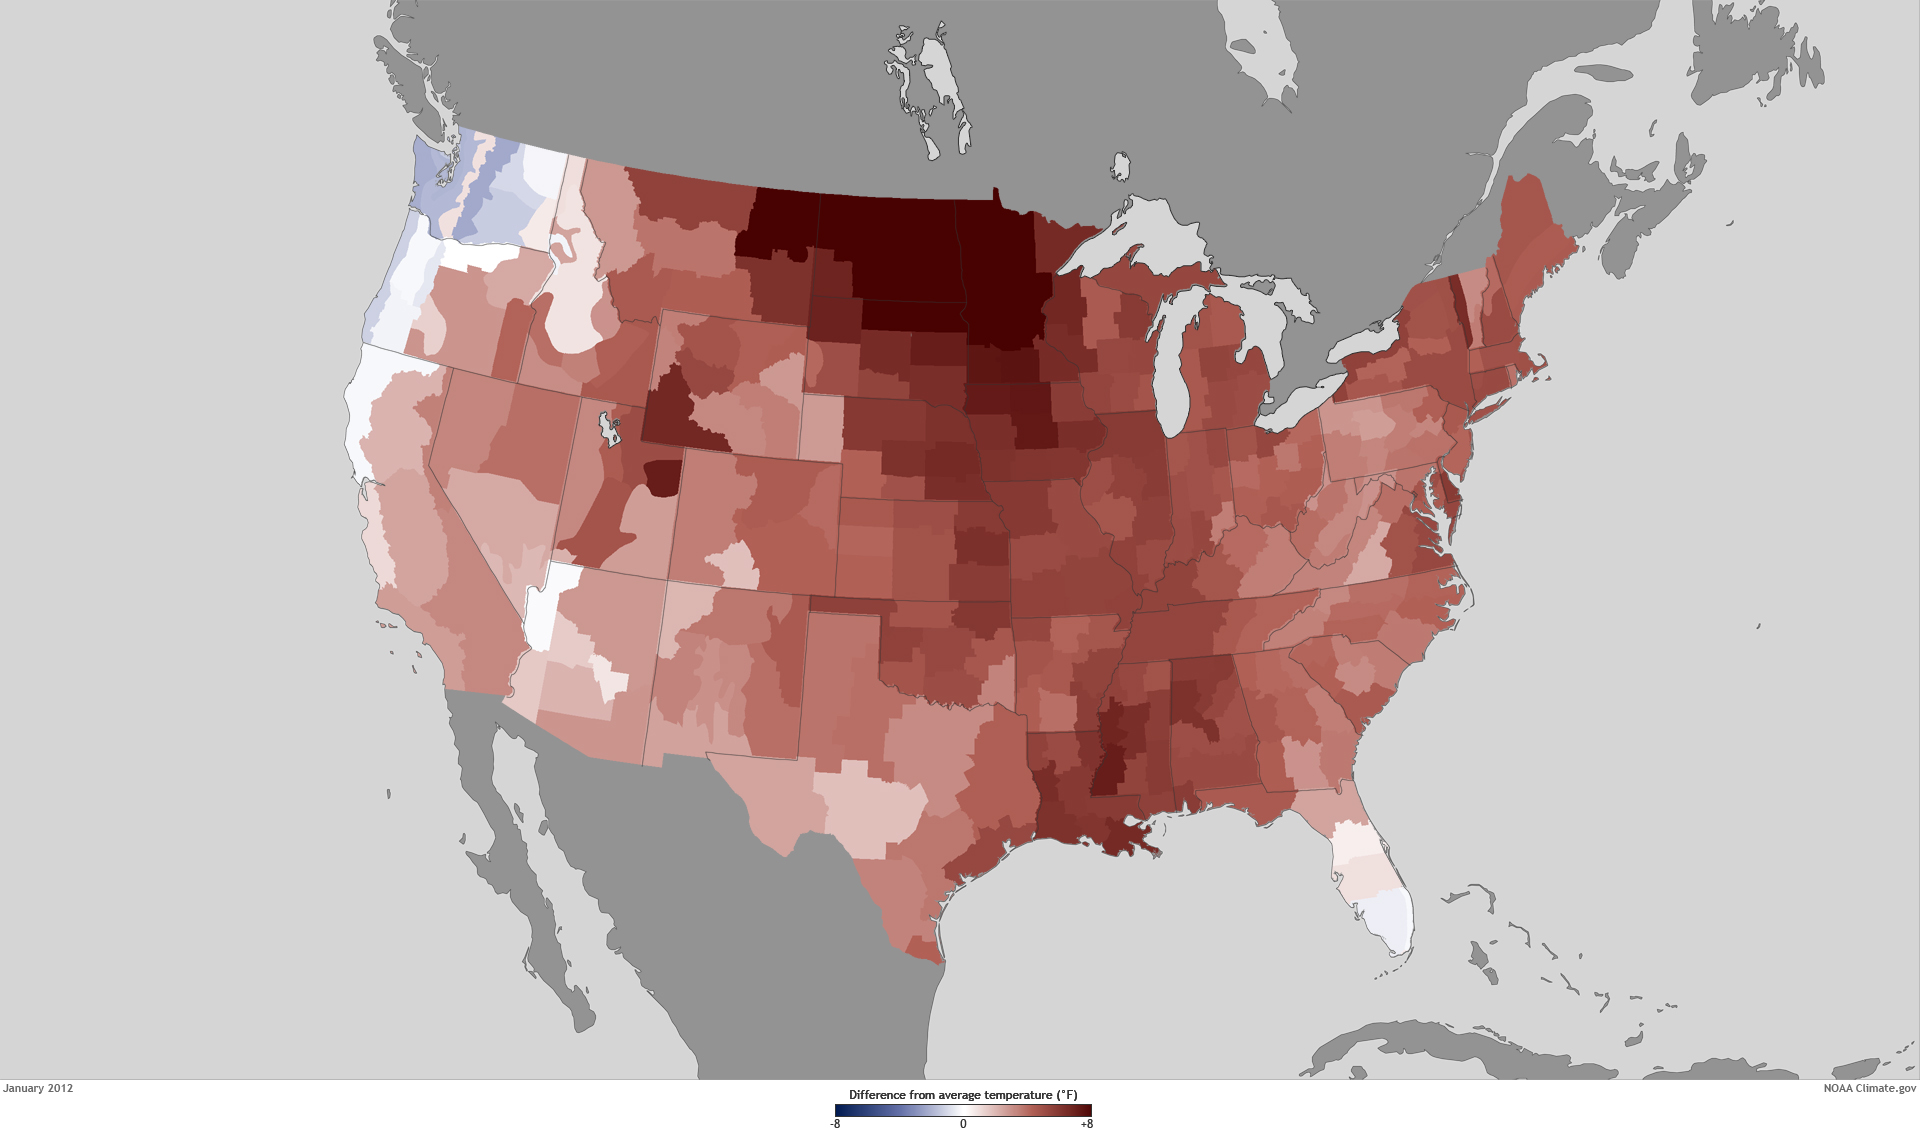
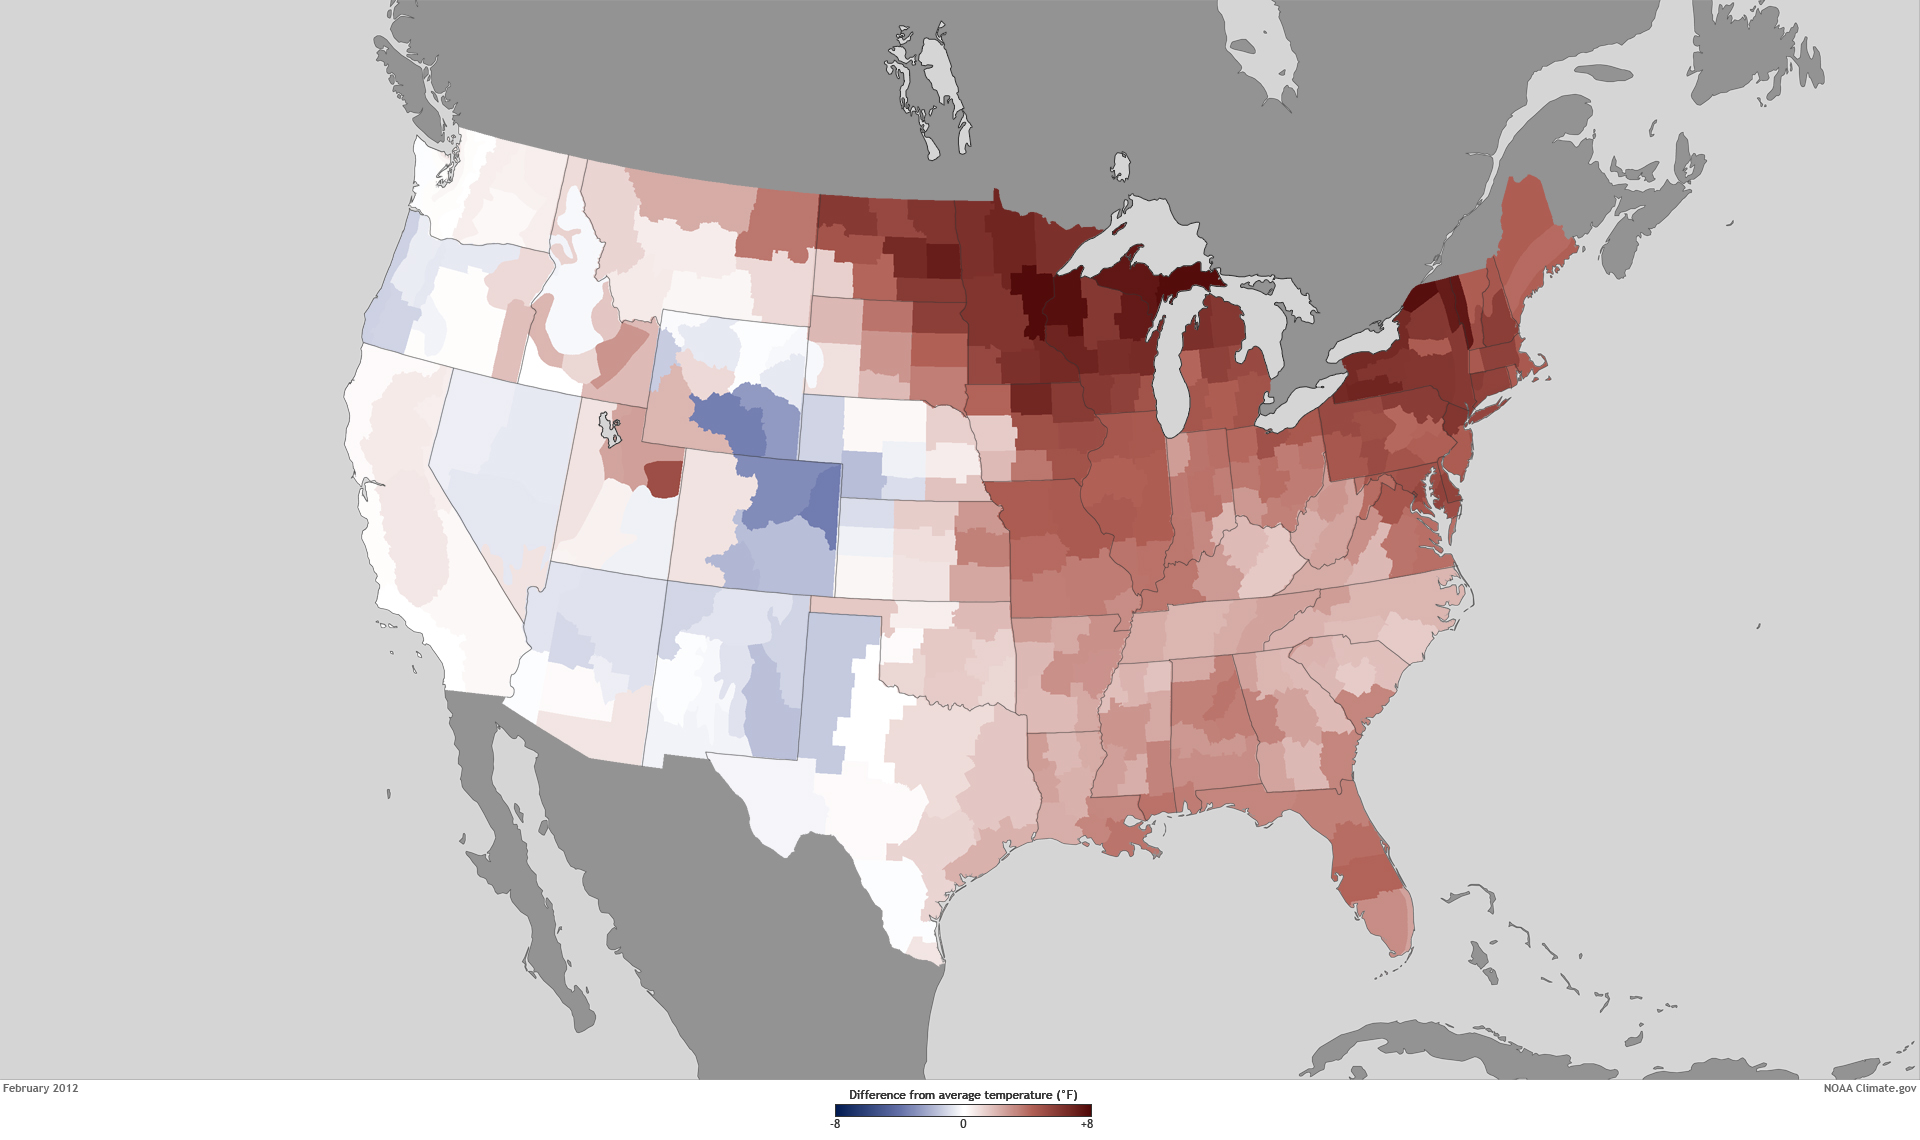
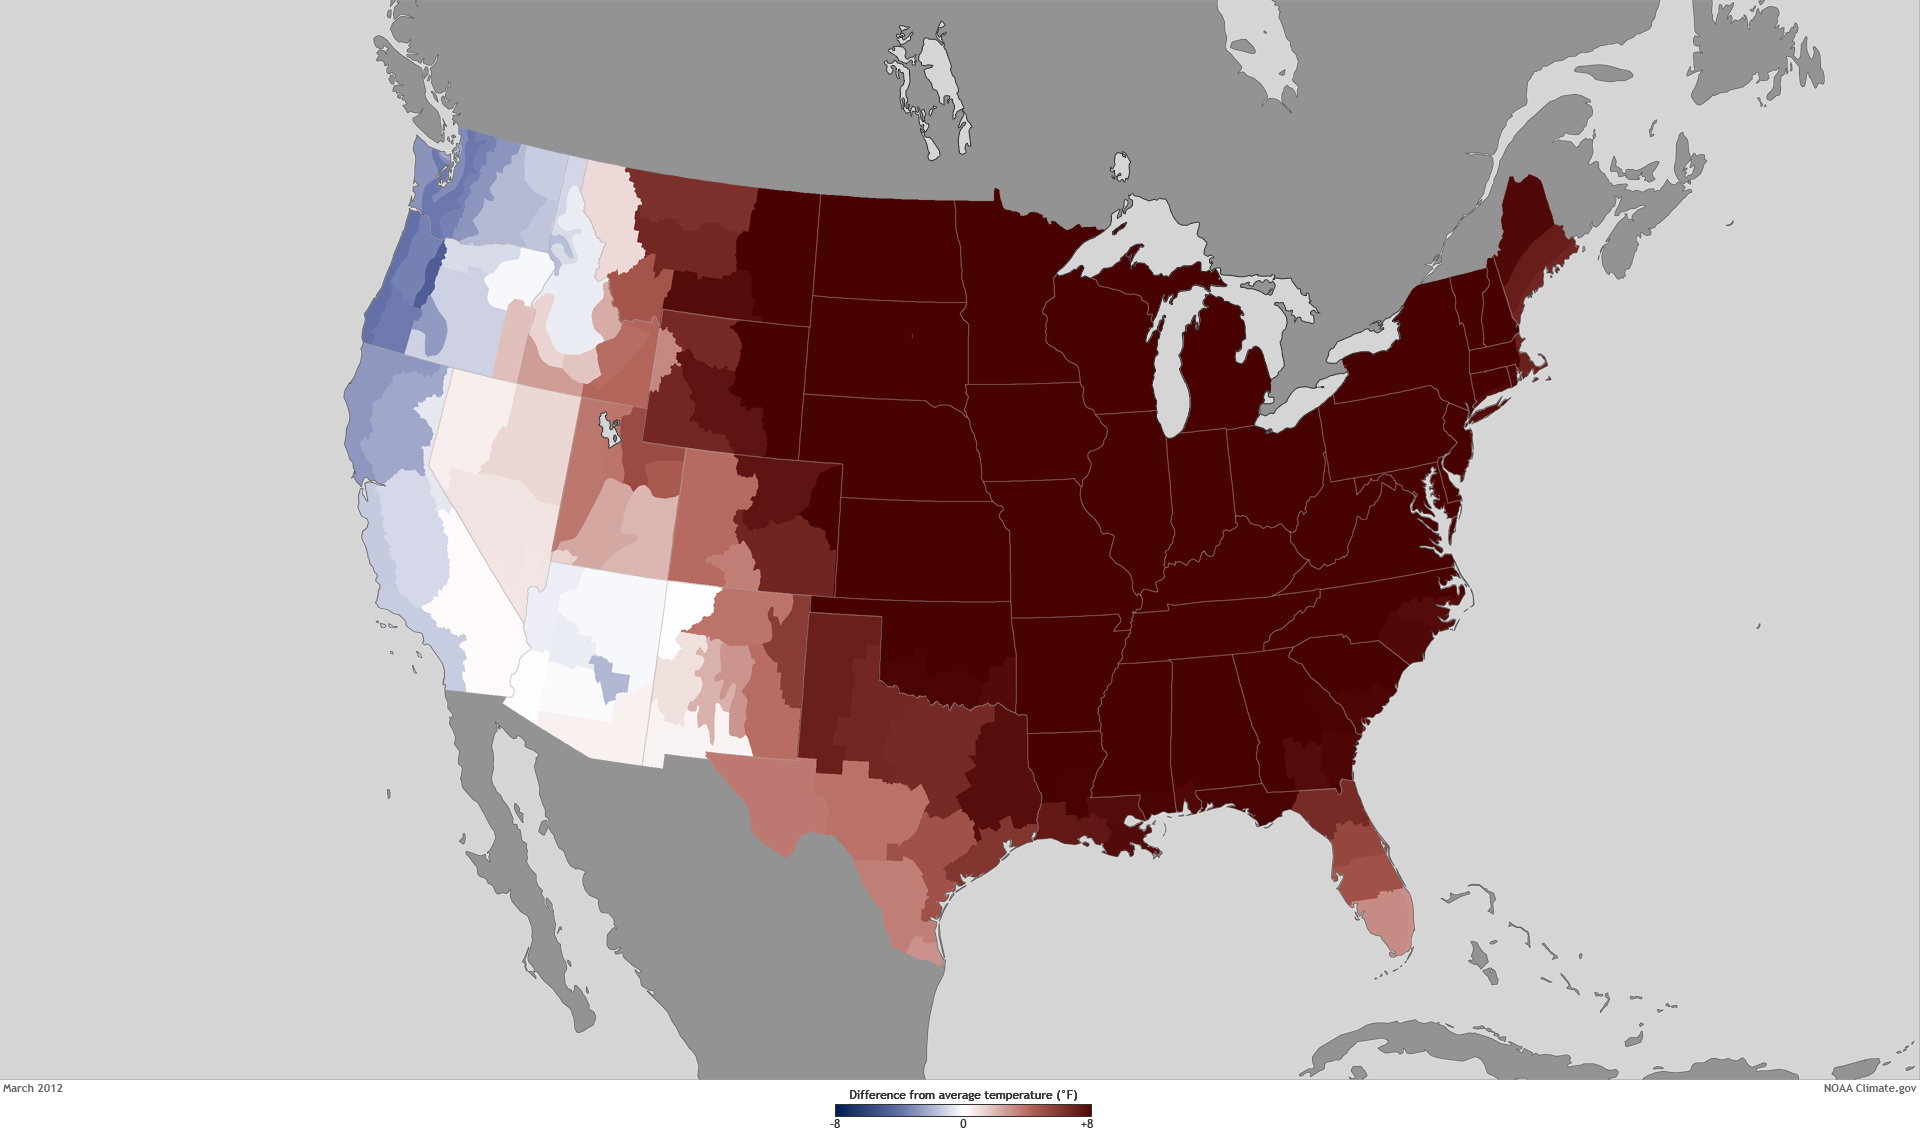
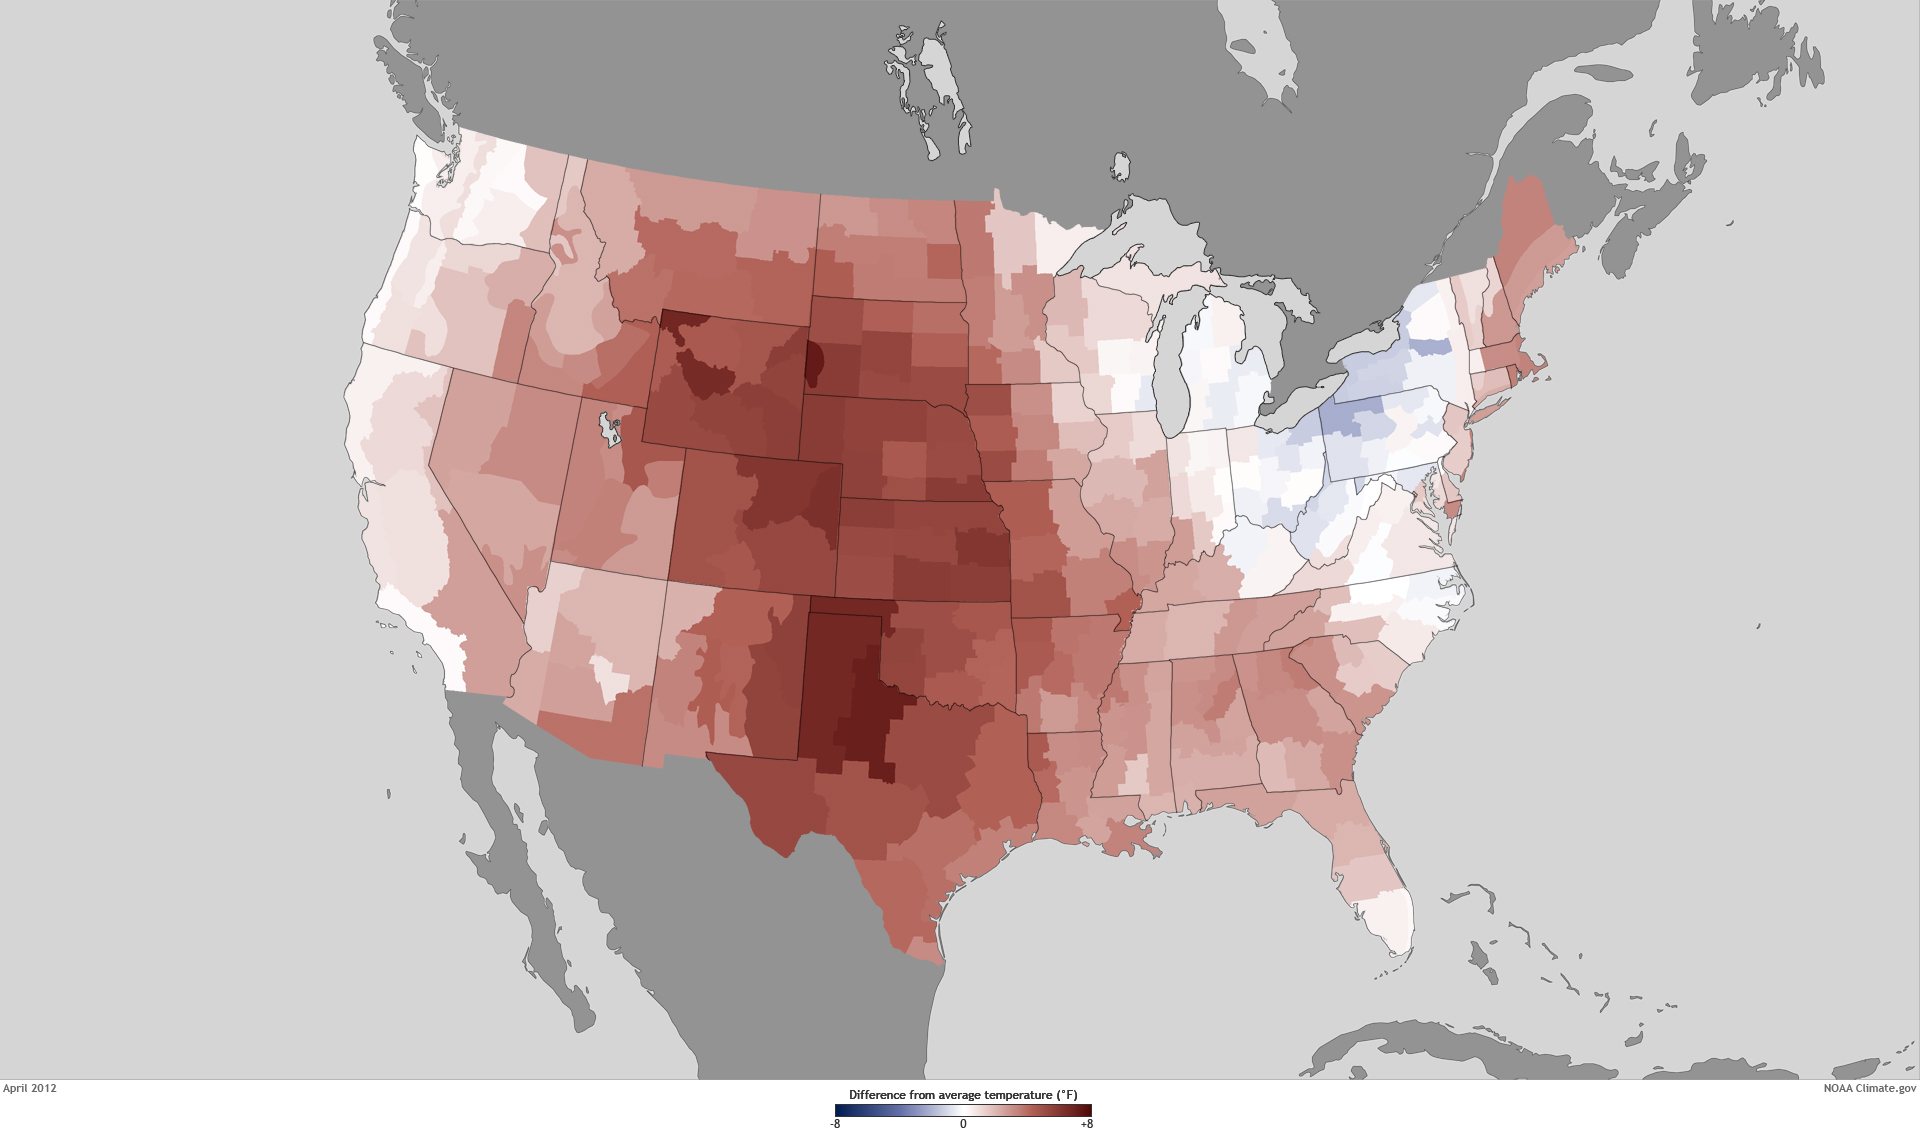
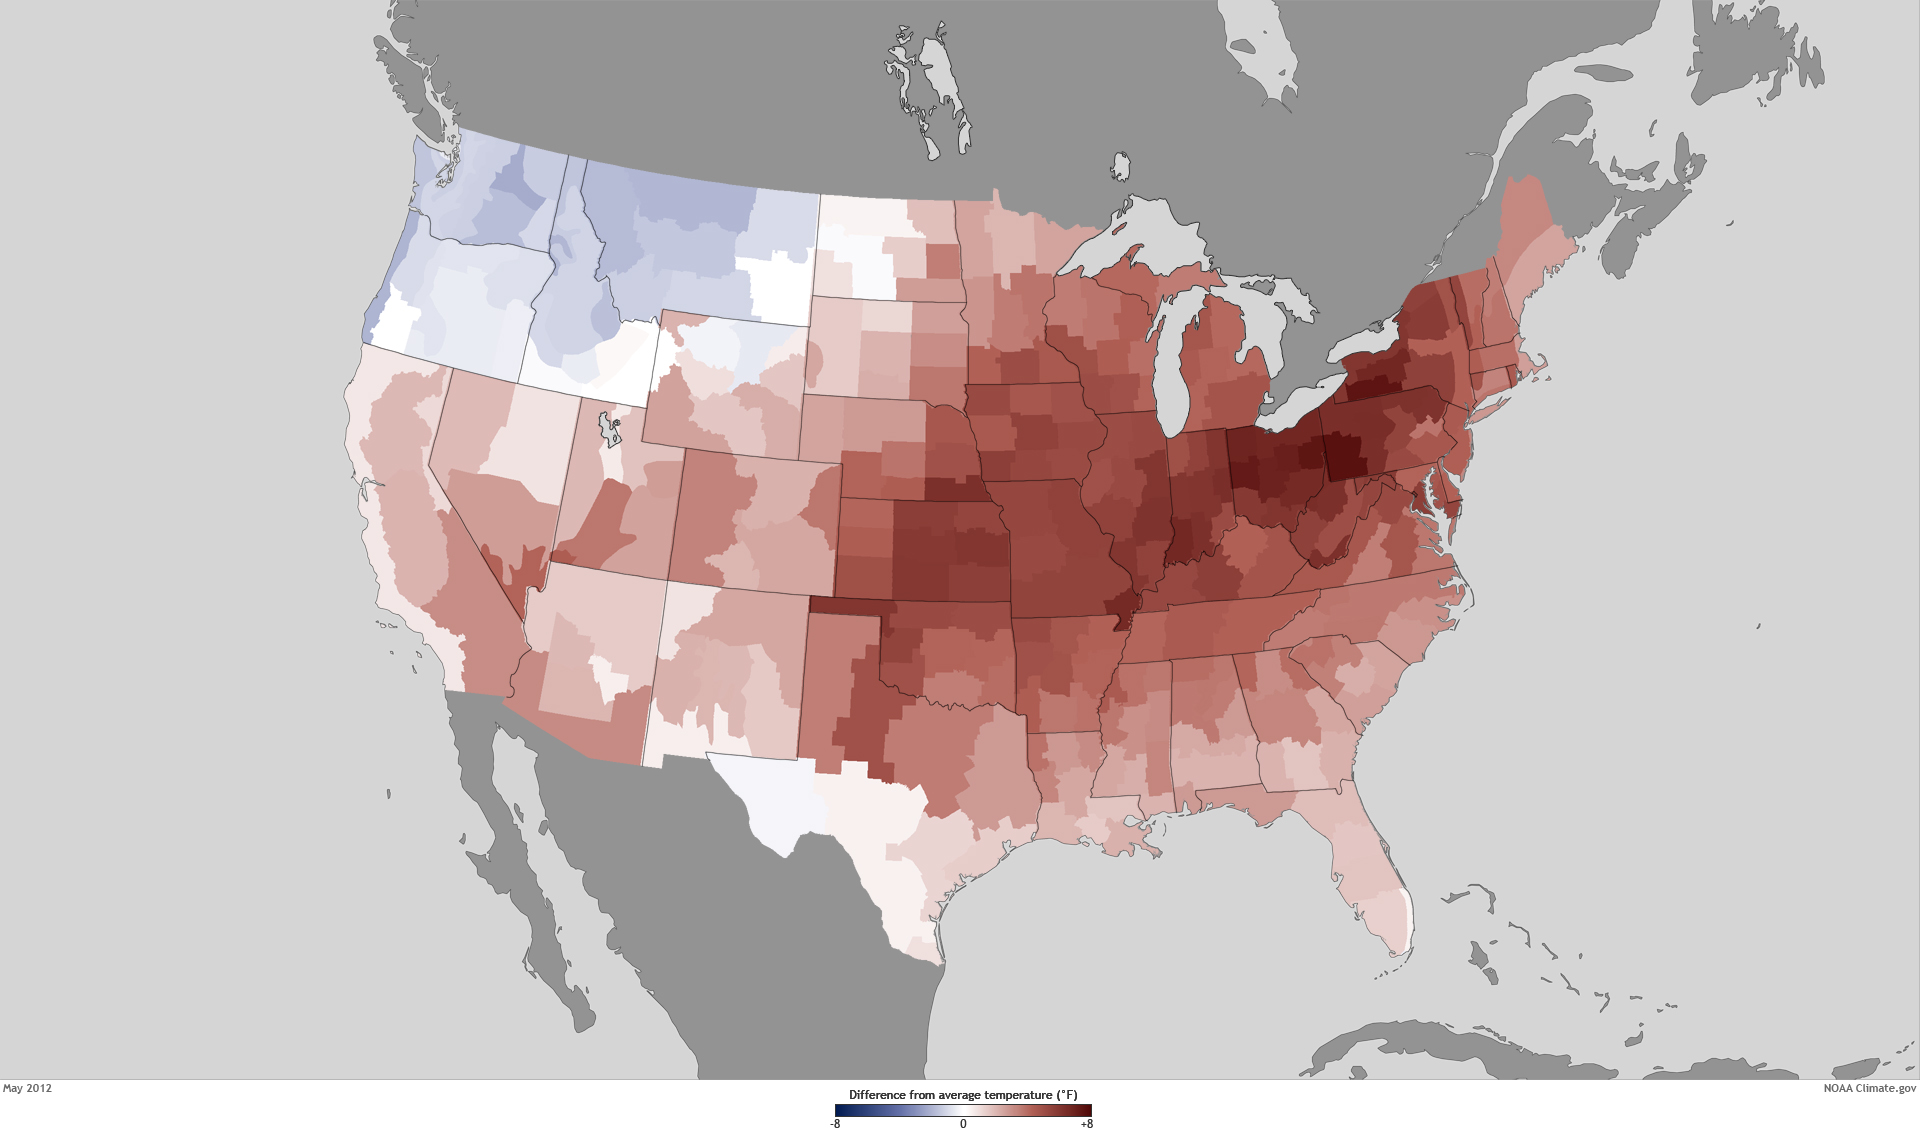
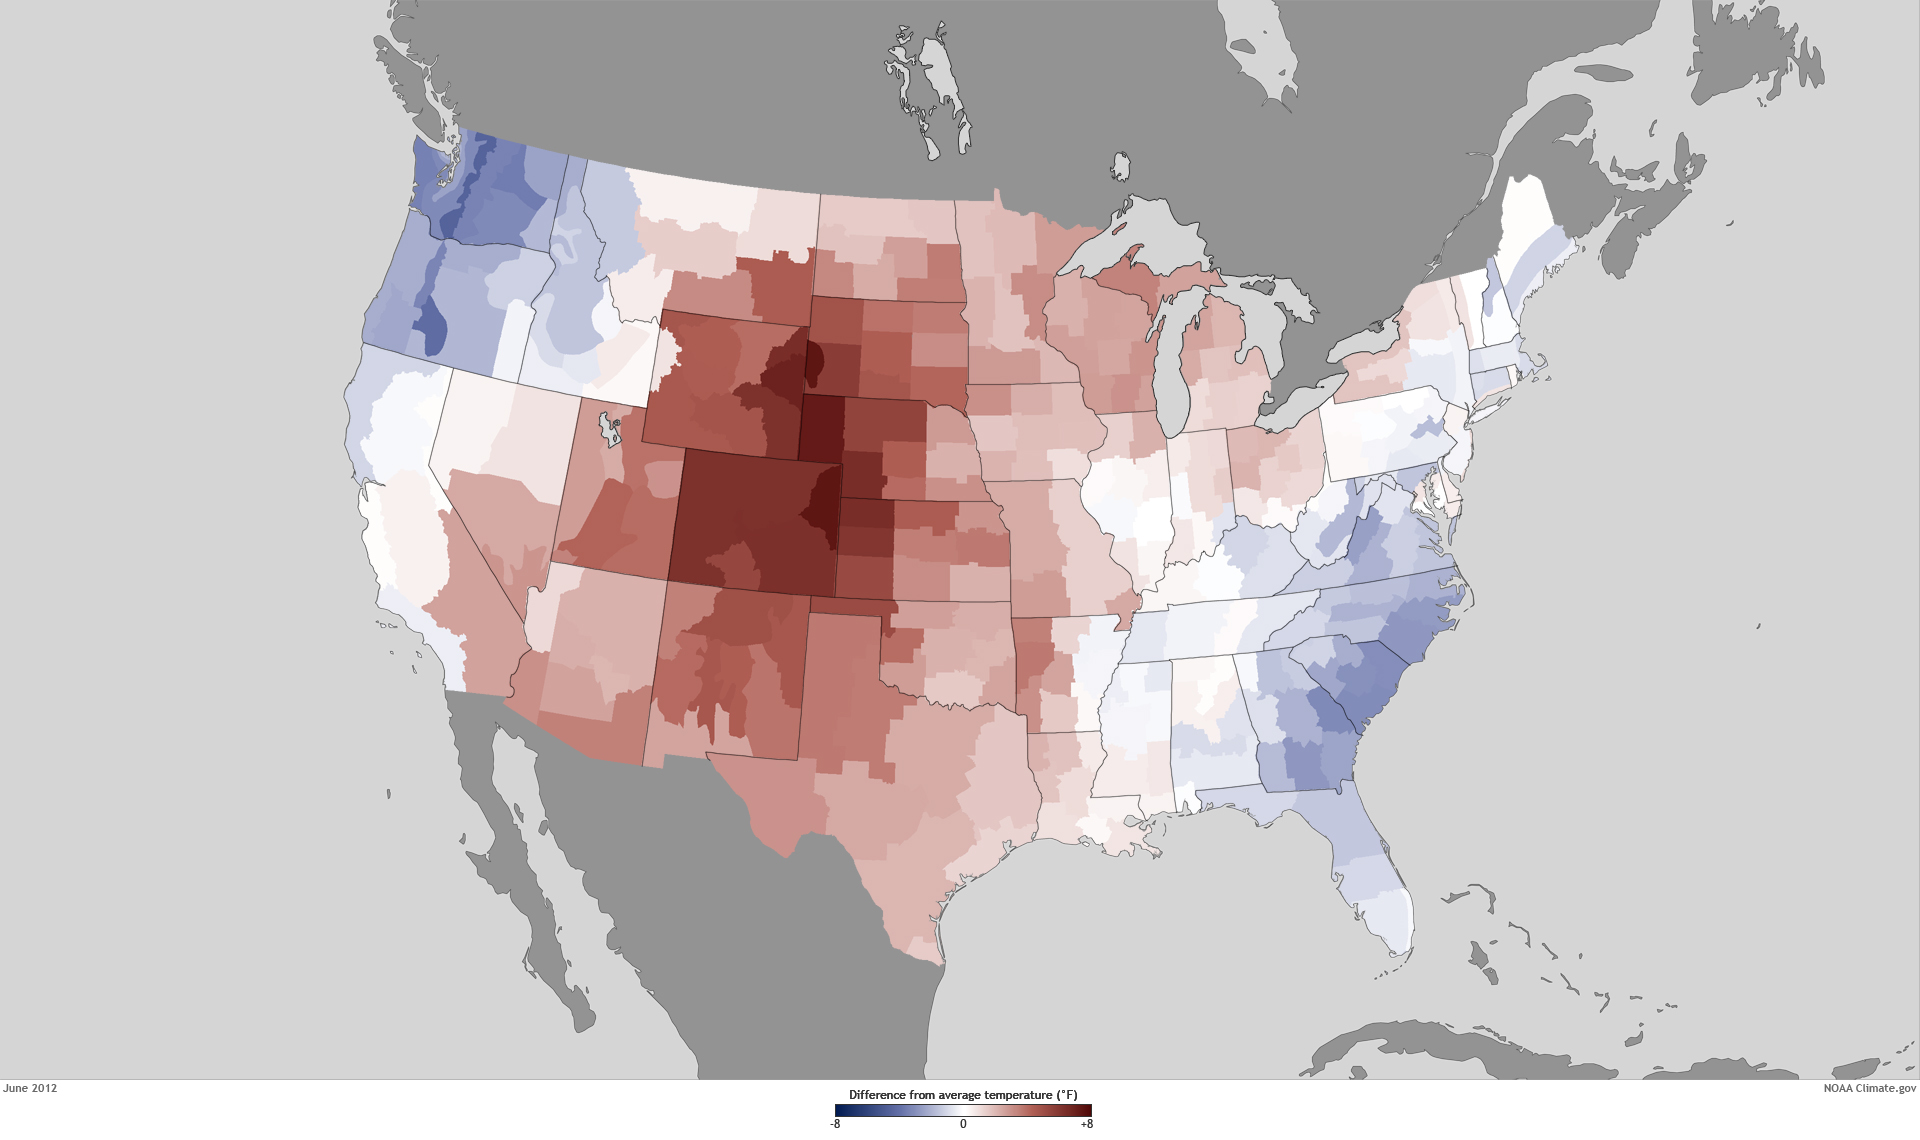
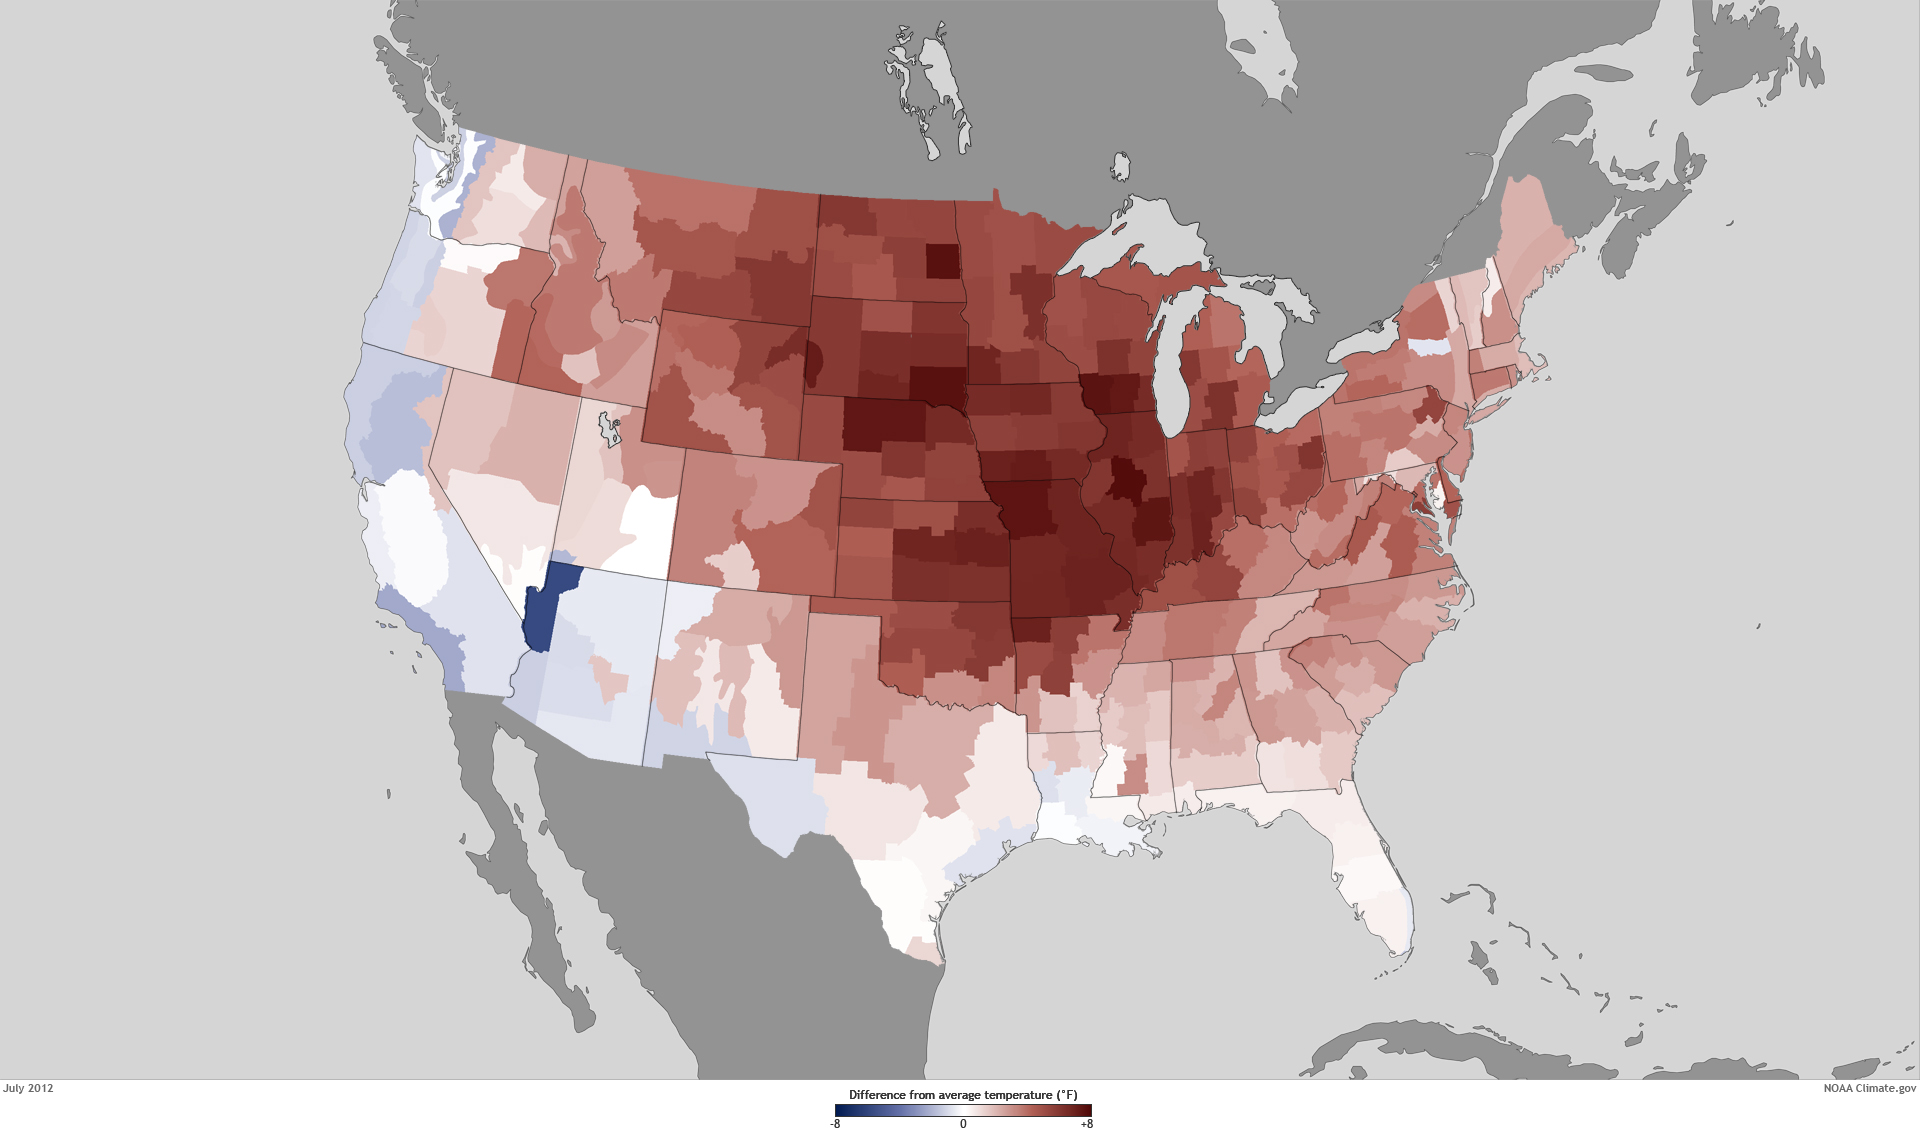
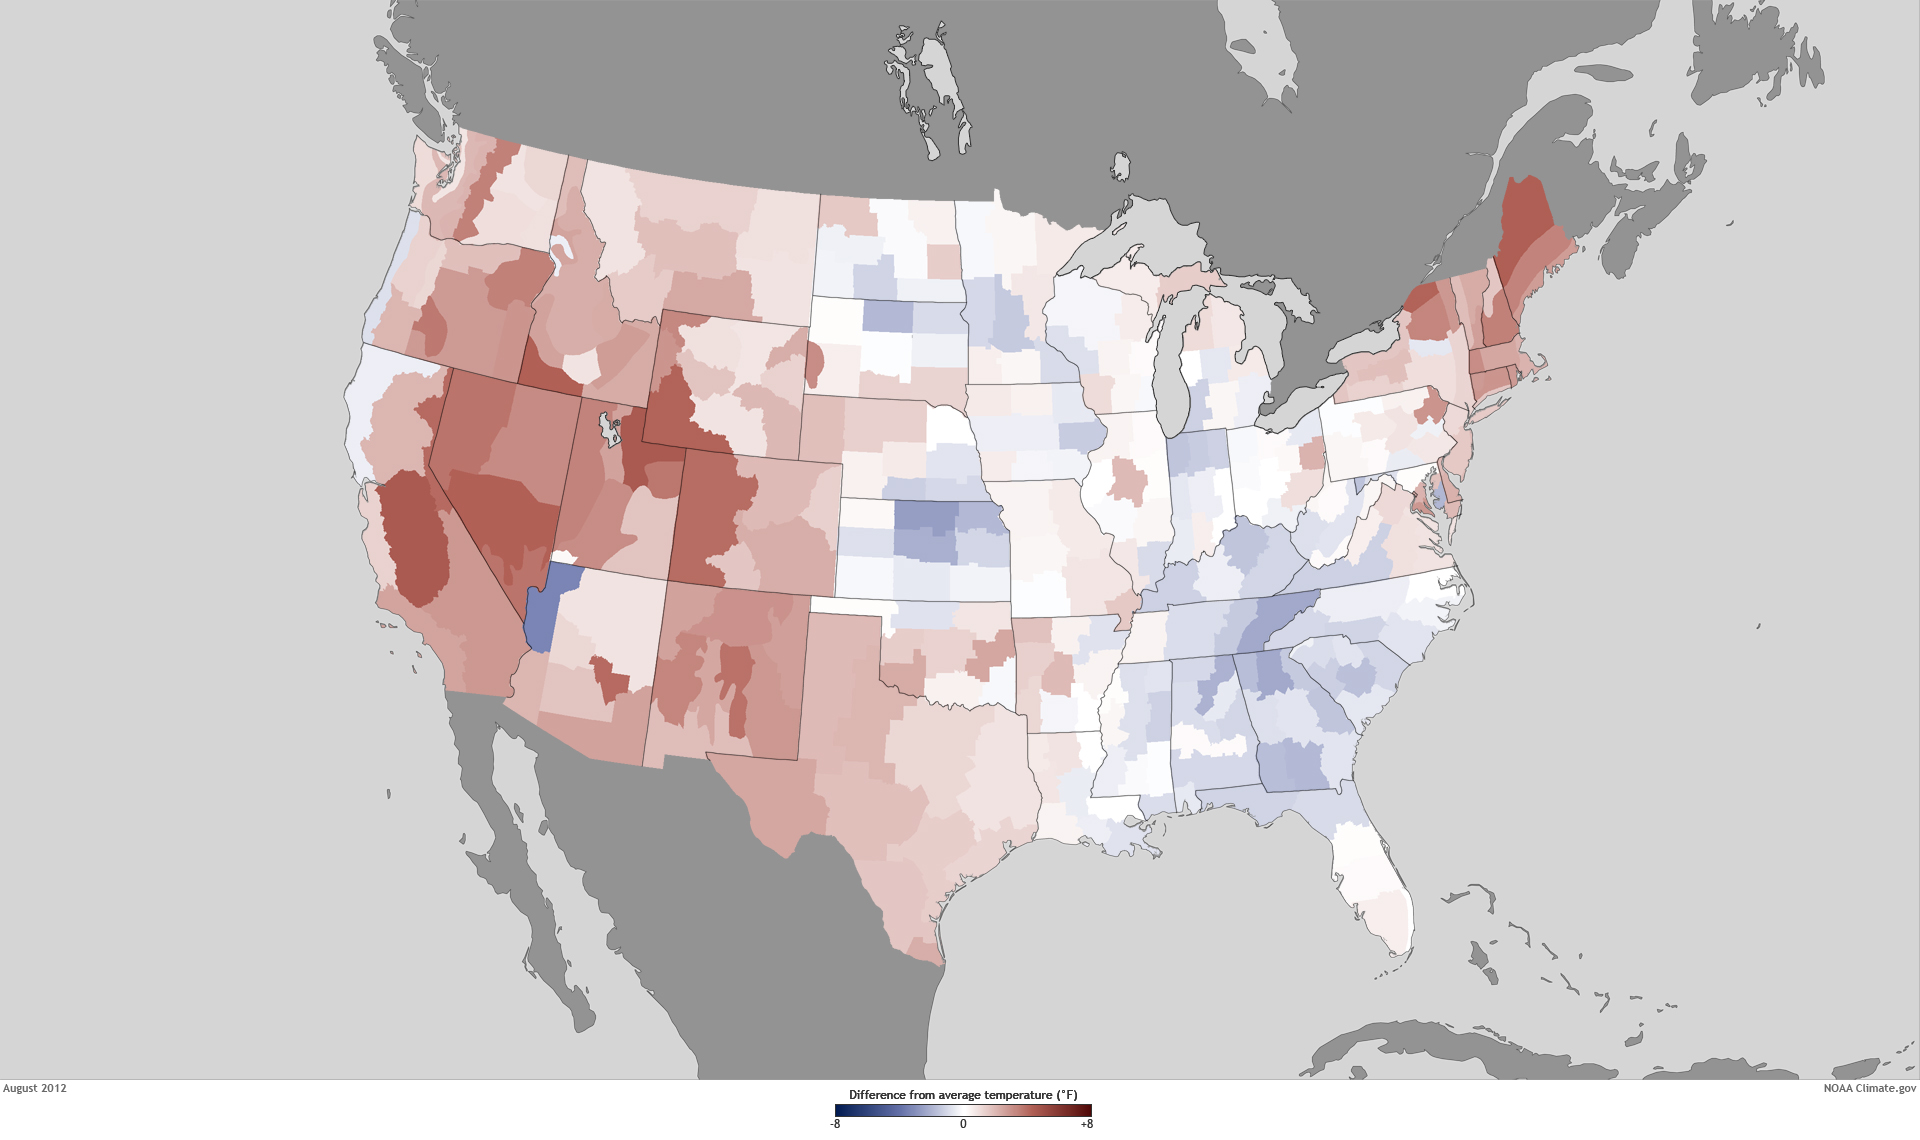
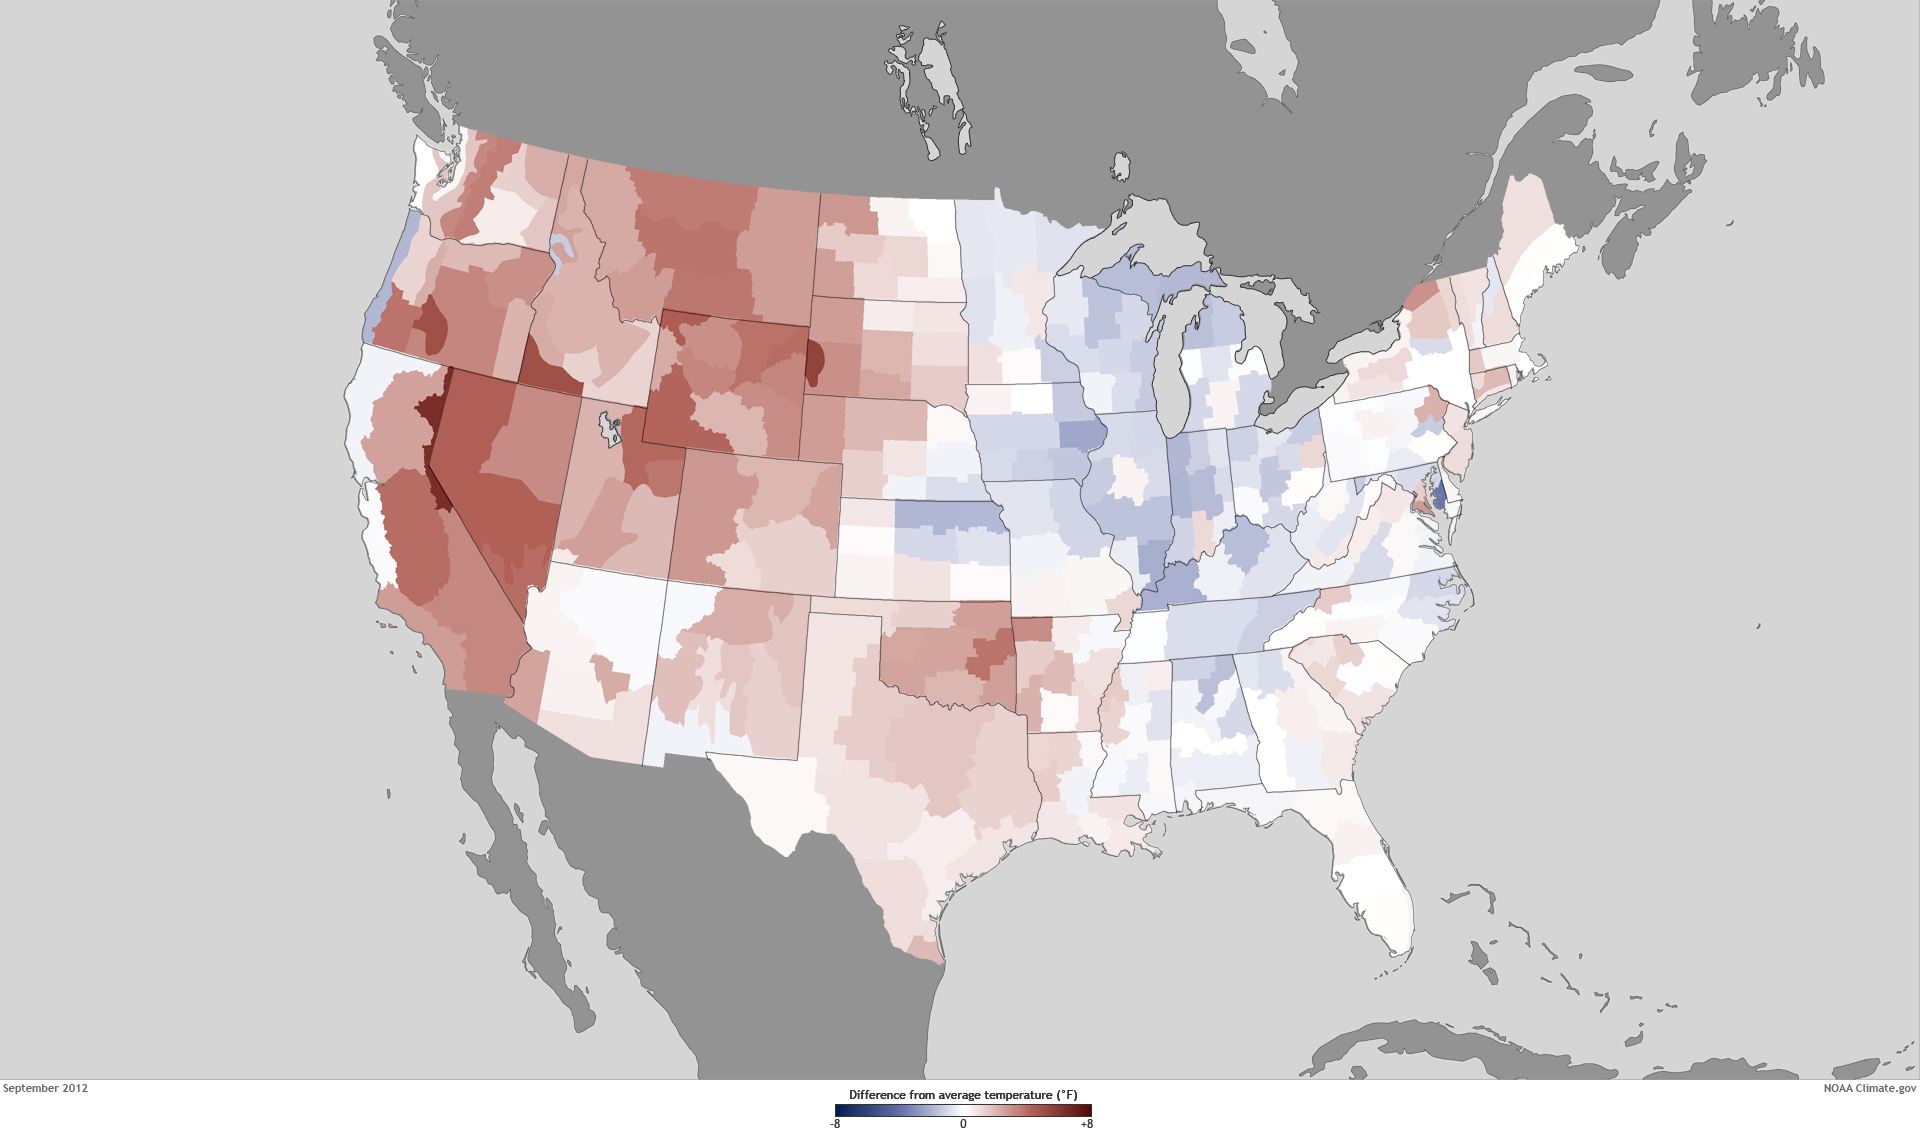
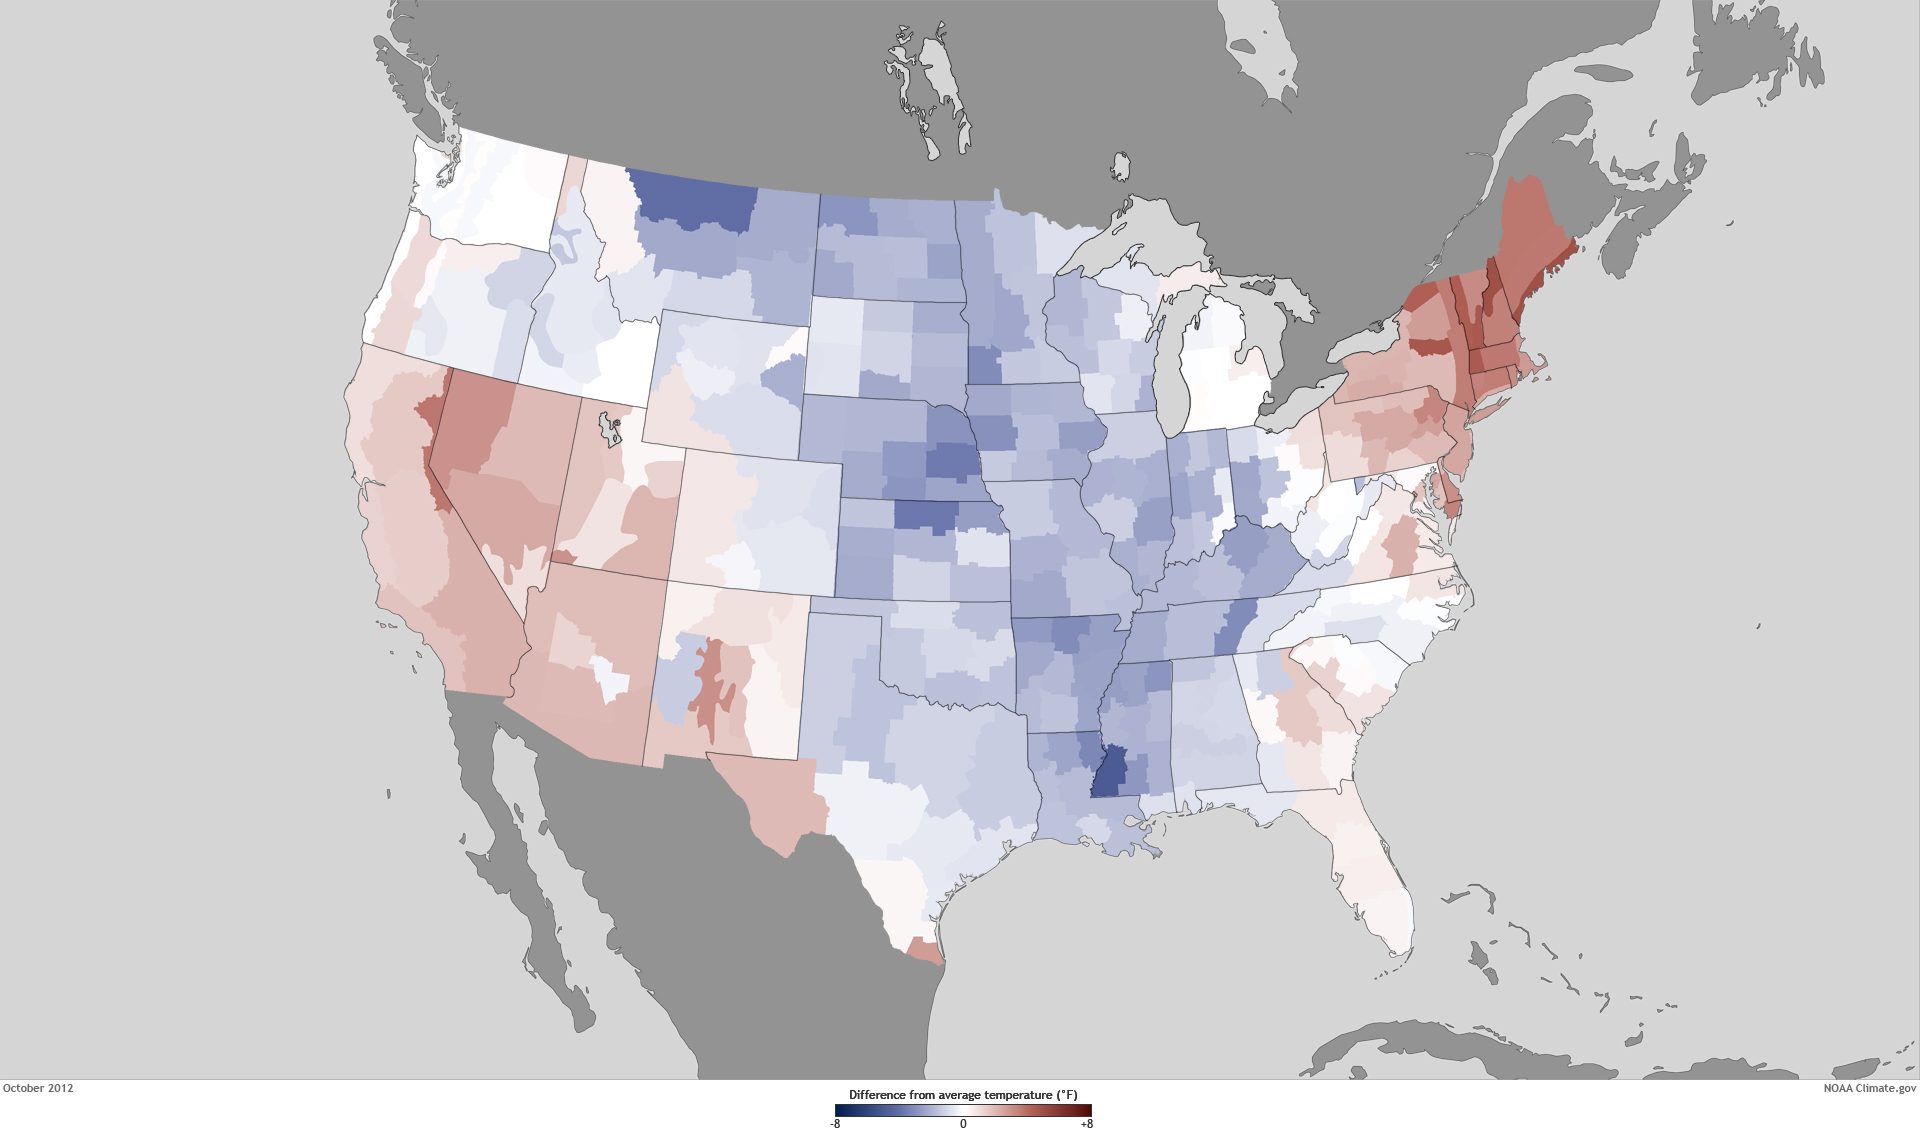
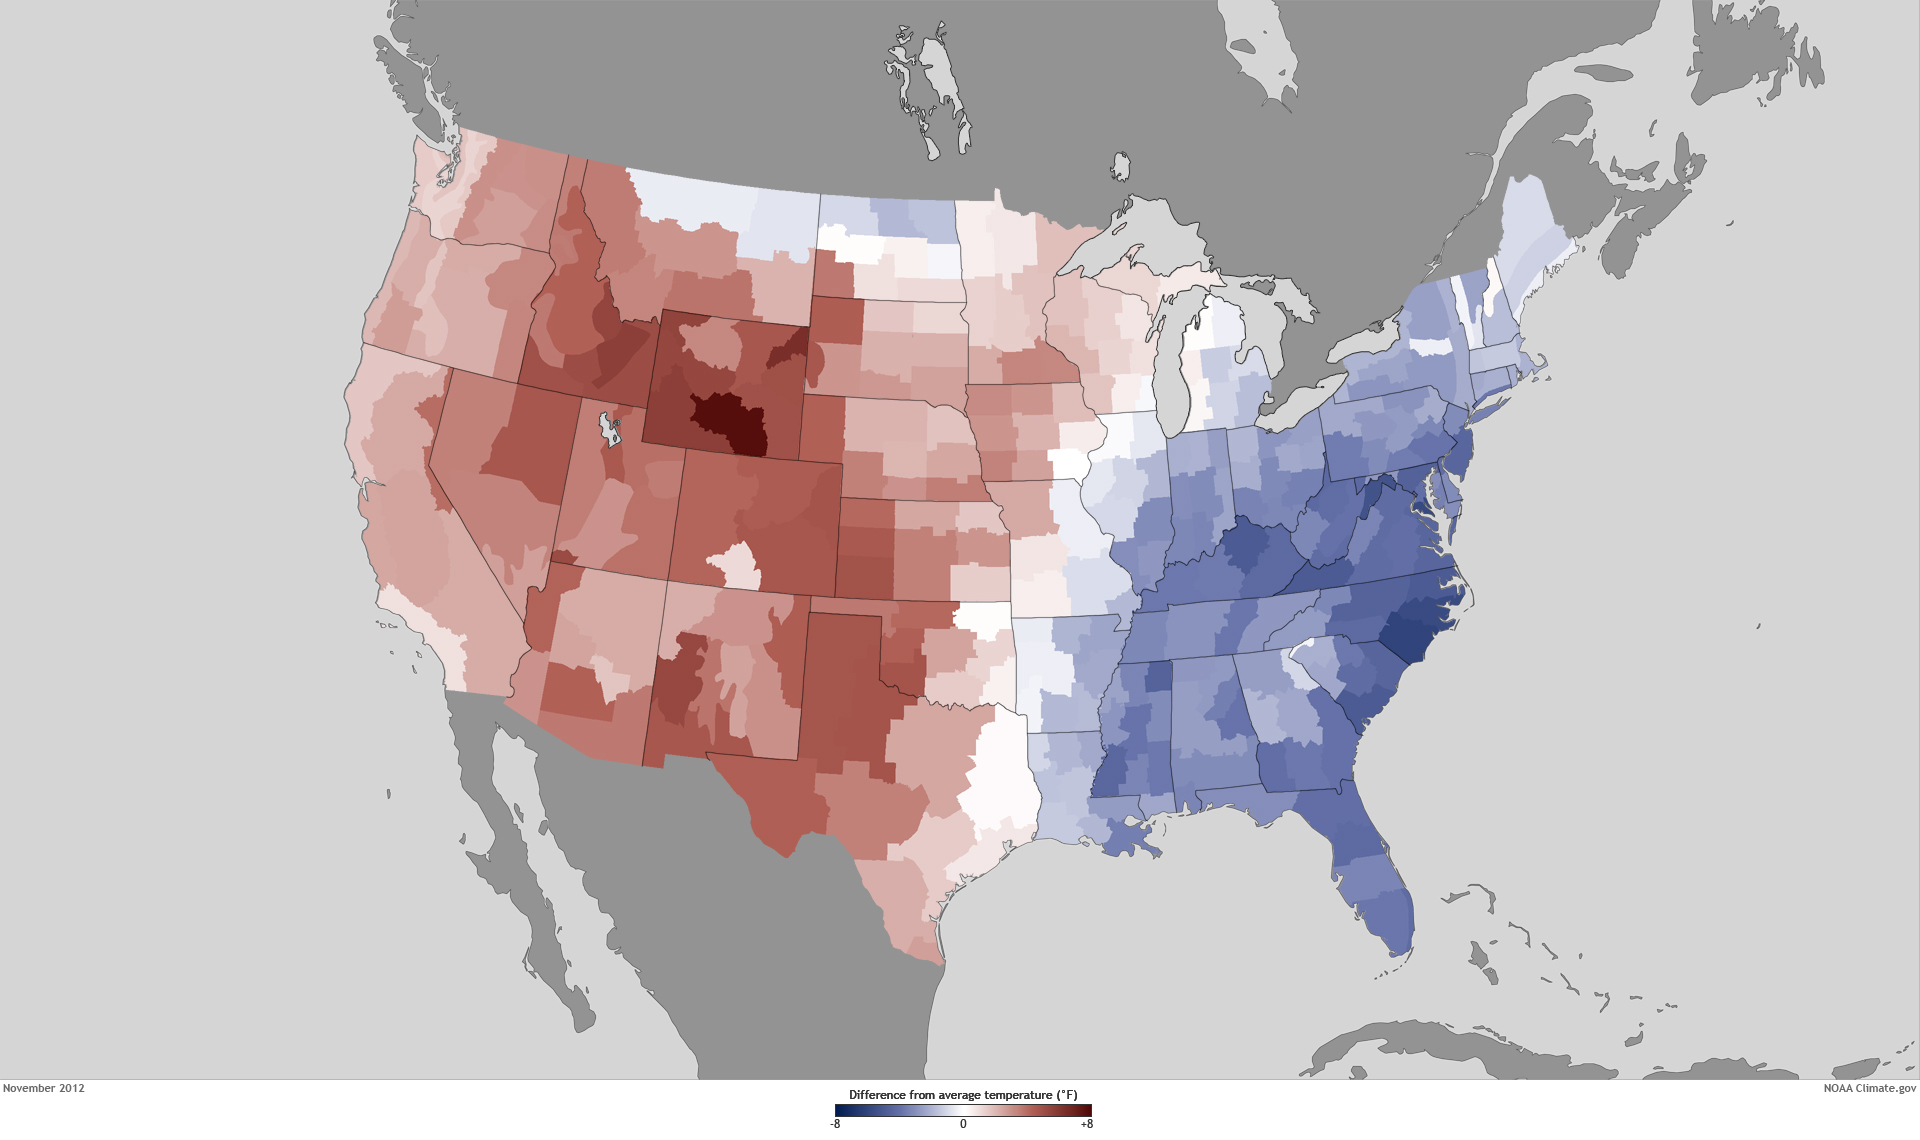
U.S. temperatures in 2012 compared to the 1981-2010 average. Download large images: 2012 | January | February | March | April | May | June | July | August |September | October | November | December NOAA Climate.gov maps based on Global Historical Climatology Network Data from the National Climatic Data Center.
The maps above shows where the 2012 temperatures were different from the 1981–2010 average. Shades of red indicate temperatures up to 8° Fahrenheit warmer than average, and shades of blue indicate temperatures up to 8° Fahrenheit cooler than average—the darker the color, the larger the difference from average temperature.
Every state in the contiguous United States had an above-average annual temperature for 2012. Nineteen states had a record-warm year, and an additional 26 states had one of their 10 warmest. On the national scale,
Every state in the contiguous United States had an above-average annual temperature for 2012. Nineteen states had a record-warm year, and an additional 26 states had one of their 10 warmest. On the national scale, 2012 started off much warmer than average, with the fourth-warmest winter (December 2011–February 2012) on record. The winter snow cover for the contiguous United States was the third smallest on record, and snowpack totals across the Central and Southern Rockies were less than half of normal.
Spring started off exceptionally warm, with the warmest March on record, followed by the fourth-warmest April and second-warmest May. The season’s temperature was 5.2° Fahrenheit above average, easily the warmest spring on record, surpassing the previous record by 2.0° Fahrenheit. The warm spring resulted in an early start to the 2012 growing season in many places, which increased water demand on the soil earlier than what is typical. In combination with the lack of winter snow and lingering dryness from 2011, the record-warm spring laid the foundation for the great drought of 2012.
The above-average temperatures of spring continued into summer. The national-scale heat peaked in July, which had an average temperature of 76.9° Fahrenheit, 3.6° Fahrenheit above average and the hottest month ever observed for the contiguous United States. The eighth-warmest June, record-hottest July, and a warmer-than-average August resulted in a summer average temperature of 73.8° Fahrenheit—the second-hottest summer on record. An estimated 99.1 million people—nearly one-third of the nation’s population—experienced 10 or more days of summer temperatures greater than 100° Fahrenheit.
Autumn and December temperatures were warmer than average, but not of the same magnitude as the three previous seasons. Autumn warmth in the western United States was balanced by cooler temperatures in the eastern half of the country, while December was warmer than average for the East. Although the last four months of 2012 did not bring the same unusual warmth as the first 8 months of the year, the September through December temperatures were warm enough for 2012 to remain the United States’ record-warmest year by a wide margin.
Maps by NOAA climate.gov team, based on Climate Division Data from the National Climatic Data Center. Caption by Susan Osborne and Jake Crouch, adapted from the December 2012 National Climate Analysis from the National Climatic Data Center. Reviewed by Jake Crouch.
Where this page came from
This page was imported from NOAA Climate.gov. Published by NOAA Climate.gov, which lets anything credited to it be re-used with attribution; material credited to others is left out.
Nobody has written it yet — it is the source material at a new address, which is why search engines are asked to skip it and why no one earns from it. It is up for grabs: take it on, and it is yours to rewrite and to earn from.
Licence: CC0 1.0 (public domain) · Adapted from www.climate.gov
1
0
0
0

Comments