
Firearm deaths and injuries have risen in recent years. Most tracking relies on hospital and death records, which often do not say where the shooting happened. Ambulance records do — and they also count people who were shot but refused hospital care or never sought it. This CDC study used emergency medical services (EMS) records to follow firearm injuries from January 2019 to September 2023 in 858 counties in 27 states.
The rise before this study
| Measure | Change |
|---|---|
| Firearm homicide rate | up 44%, from 4.4 to 6.3 per 100,000 people, 2019–2021; still 5.9 in 2022 |
| Firearm suicide rate | up 11%, from 7.3 to 8.1 per 100,000, 2019–2022 |
| Emergency department visits for firearm injury, mean per week, against 2019 | 37% higher in 2020, 36% in 2021, 20% in 2022 |
How the study worked
- Data: EMS records collected by biospatial, Inc., from counties where the records received covered at least 75% of the expected EMS encounters in every quarter of the study.
- What counted: gunshot injuries from handguns, rifles and shotguns, whatever the intent — unintentional, self-harm, assault, legal intervention, terrorism or undetermined — found by searching dispatch information, chief complaints, narratives and diagnosis codes. Air, gas, BB and pellet guns, non-penetrating injuries such as pistol-whipping, and follow-up care were left out.
- The rate: firearm injury encounters per 100,000 EMS encounters of any kind, compared with 2019. For 2023, January–September is compared with the same months of 2019.
- County factors from County Health Rankings & Roadmaps 2023, each split into quartiles: severe housing problems (no working plumbing or kitchen, overcrowding, or housing costing more than half the household's income), income inequality (income at the 80th percentile against the 20th), unemployment, and urbanicity (NCHS's six-level urban–rural scheme).
Year by year
| Year | Firearm injury EMS encounters per 100,000 | Against 2019 |
|---|---|---|
| 2019 | 222.7 | — |
| 2020 | 294.9 | 32% higher |
| 2021 | 283.4 | 27% higher |
| 2022 | 261.4 | 17% higher |
| 2023 (Jan–Sep) | 252.8 | 14% higher |
After COVID-19 was declared a national emergency in March 2020, the monthly rate jumped sharply across many groups. Total EMS calls dipped only briefly — 16.5% below 2019 in April 2020 and 10.4% below in May — and were back to pre-pandemic levels by June.
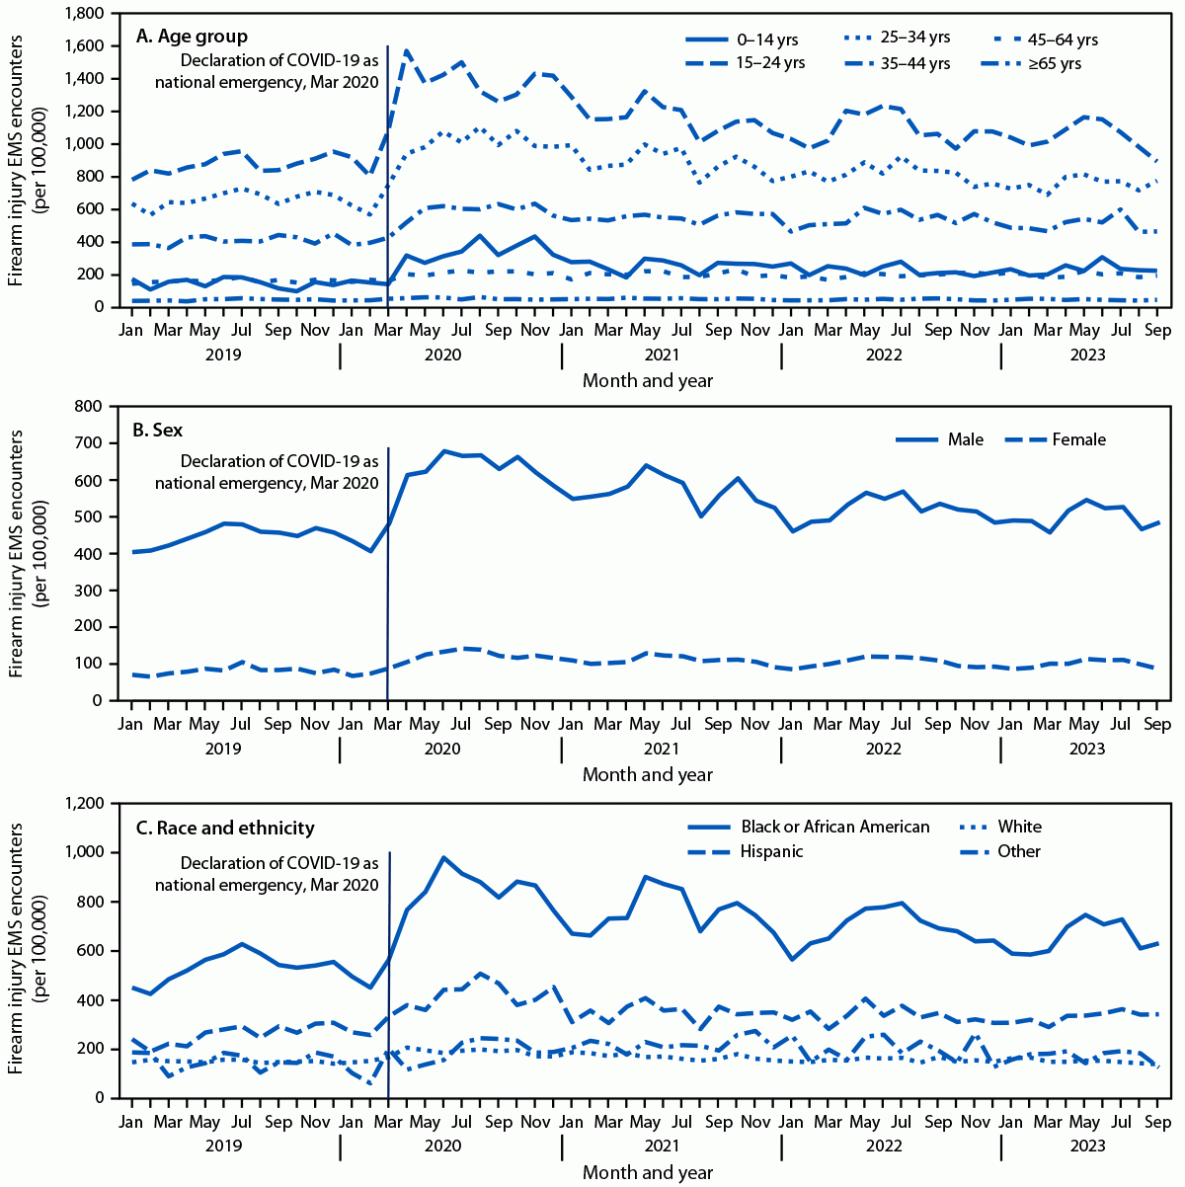
Figure 1. Monthly rate of firearm injury EMS encounters per 100,000 EMS encounters, by age group, sex, and race and ethnicity. CDC
Who was hurt
| Group | 2019 | 2020 | 2023 (Jan–Sep) | 2023 against 2019 (rate ratio) |
|---|---|---|---|---|
| Age 0–14 | 148.5 | 290.6 | 235.0 | 1.52 |
| Age 15–24 | 875.7 | 1,277.7 | 1,045.0 | 1.21 |
| Age 25–34 | 667.5 | 931.1 | 758.0 | 1.15 |
| Age 35–44 | 413.0 | 552.3 | 507.7 | 1.24 |
| Age 45–64 | 164.0 | 200.8 | 201.4 | 1.23 |
| Age 65 and older | 48.0 | 53.8 | 49.1 | 1.02 |
| Female | 81.7 | 112.5 | 99.7 | 1.22 |
| Male | 449.3 | 589.4 | 500.0 | 1.12 |
| Black | 537.0 | 770.4 | 656.3 | 1.23 |
| Hispanic or Latino | 262.1 | 393.8 | 332.5 | 1.32 |
| White | 151.0 | 181.7 | 152.2 | 1.00 |
| Other | 153.4 | 179.4 | 171.8 | 1.15 |
Rates per 100,000 EMS encounters. "Other" combines Asian, American Indian or Alaska Native, and Native Hawaiian or Pacific Islander people, to avoid suppressing small counts.
- Young people aged 15–24 had the highest rates every year. The largest increases were among children and adolescents aged 0–14 — a rate ratio of 1.96 in 2020 — and they remained the most elevated group in 2023.
- Males had consistently higher rates, but the increases were larger among females.
- Black people had the highest rates throughout. The single biggest one-year jump in any racial or ethnic group was among Hispanic people from 2019 to 2020. Rates for Black and Hispanic people stayed high through 2023; for the other groups they were back at pre-pandemic levels by then.
These patterns match what emergency department data, EMS data on penetrating injuries, and death records have shown.
Where it happened
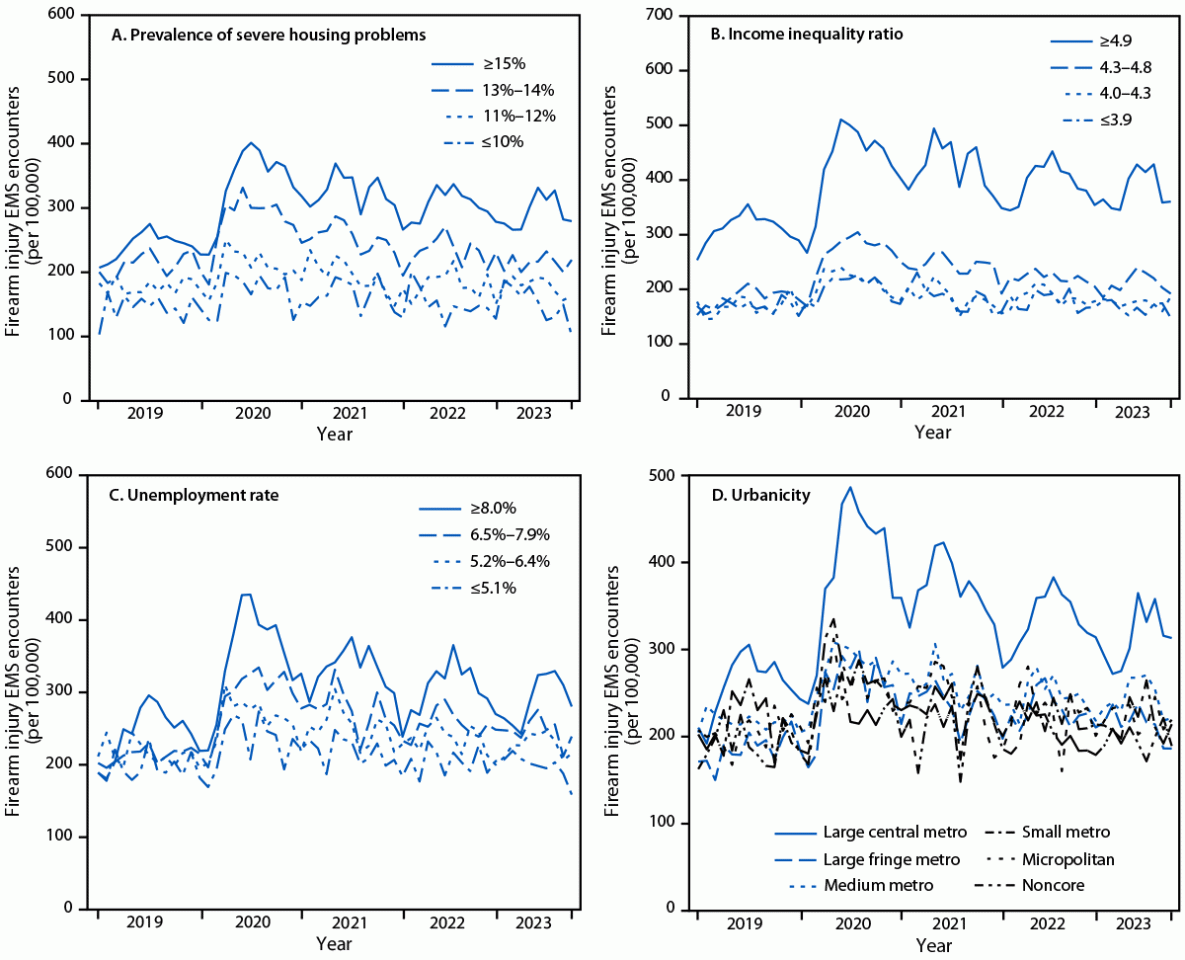
Figure 2. Monthly rate of firearm injury EMS encounters, by county characteristics. CDC
The monthly rate rose at every level of every county factor, but most in:
| County type | 2019 | 2020 | 2023 (Jan–Sep) | 2023 against 2019 |
|---|---|---|---|---|
| Large central metro | 261.2 | 382.3 | 314.7 | 1.22 |
| Most severe housing problems (15% of households or more) | 242.7 | 333.4 | 293.9 | 1.21 |
| Widest income gap (ratio 4.9 or more) | 313.9 | 421.8 | 383.7 | 1.22 |
| Highest unemployment (8.0% or more) | 248.9 | 343.6 | 291.7 | 1.18 |
| For comparison: fewest housing problems (10% or less) | 145.1 | 166.0 | 151.7 | 1.04 |
| For comparison: narrowest income gap (3.9 or less) | 170.0 | 200.3 | 165.6 | 0.98 |
A study of emergency department visits in 10 U.S. jurisdictions found the same thing: firearm injury rates were highest in communities facing the greatest social and economic disadvantage.
Why it may have risen
Explanations offered elsewhere for the pandemic rise include more gun buying, changes in intimate partner violence, changes in social support, and disruption of health care (such as access to mental health services), social services and emergency services.
What can be done
Because EMS records pin down where injuries happen, they can be combined with other data to guide and evaluate a comprehensive approach to prevention:
- tackling underlying gaps in housing and economic security — financial security, economic opportunity, safe and stable housing;
- building protective community environments and resilient community infrastructure, including improving the physical environment;
- hospital- and community-based outreach and violence interruption programs;
- secure firearm storage.
Linking EMS injury locations with hospital and residence data could also show how patients move through care and how they fare.
Limits
- The counties are not nationally representative.
- The brief fall in total EMS calls early in the pandemic may have inflated the 2020 rate for a short time, though call volumes recovered quickly.
- The definition does not separate assaults, unintentional injuries and self-harm.
- Injuries that were immediately fatal and never involved an EMS assessment are missing.
- County-level factors meant averaging over whole counties, though EMS data could locate injuries more precisely.
- Data quality and completeness vary by provider, agency, place and period.
If you or someone you know is thinking about suicide, call or text 988 to reach the 988 Suicide & Crisis Lifeline in the United States.
Sources
Based on Rowh A, Zwald M, Fowler K, Jack S, Siordia C, Walters J, "Emergency Medical Services Encounters for Firearm Injuries — 858 Counties, United States, January 2019–September 2023," MMWR Morbidity and Mortality Weekly Report volume 73, number 24, Centers for Disease Control and Prevention; a work of the United States government in the public domain. The report's list of participating states names 26 states and 857 counties against the 27 and 858 in its title, so this page does not reproduce the list.
Licence: CC0 1.0 (public domain) · Adapted from www.cdc.gov
1
0
0
0

Comments


