NOAA News Story
Risk of moderate flooding for parts of central and eastern United States this spring. No drought relief in sight for California, Nevada, or Oregon.
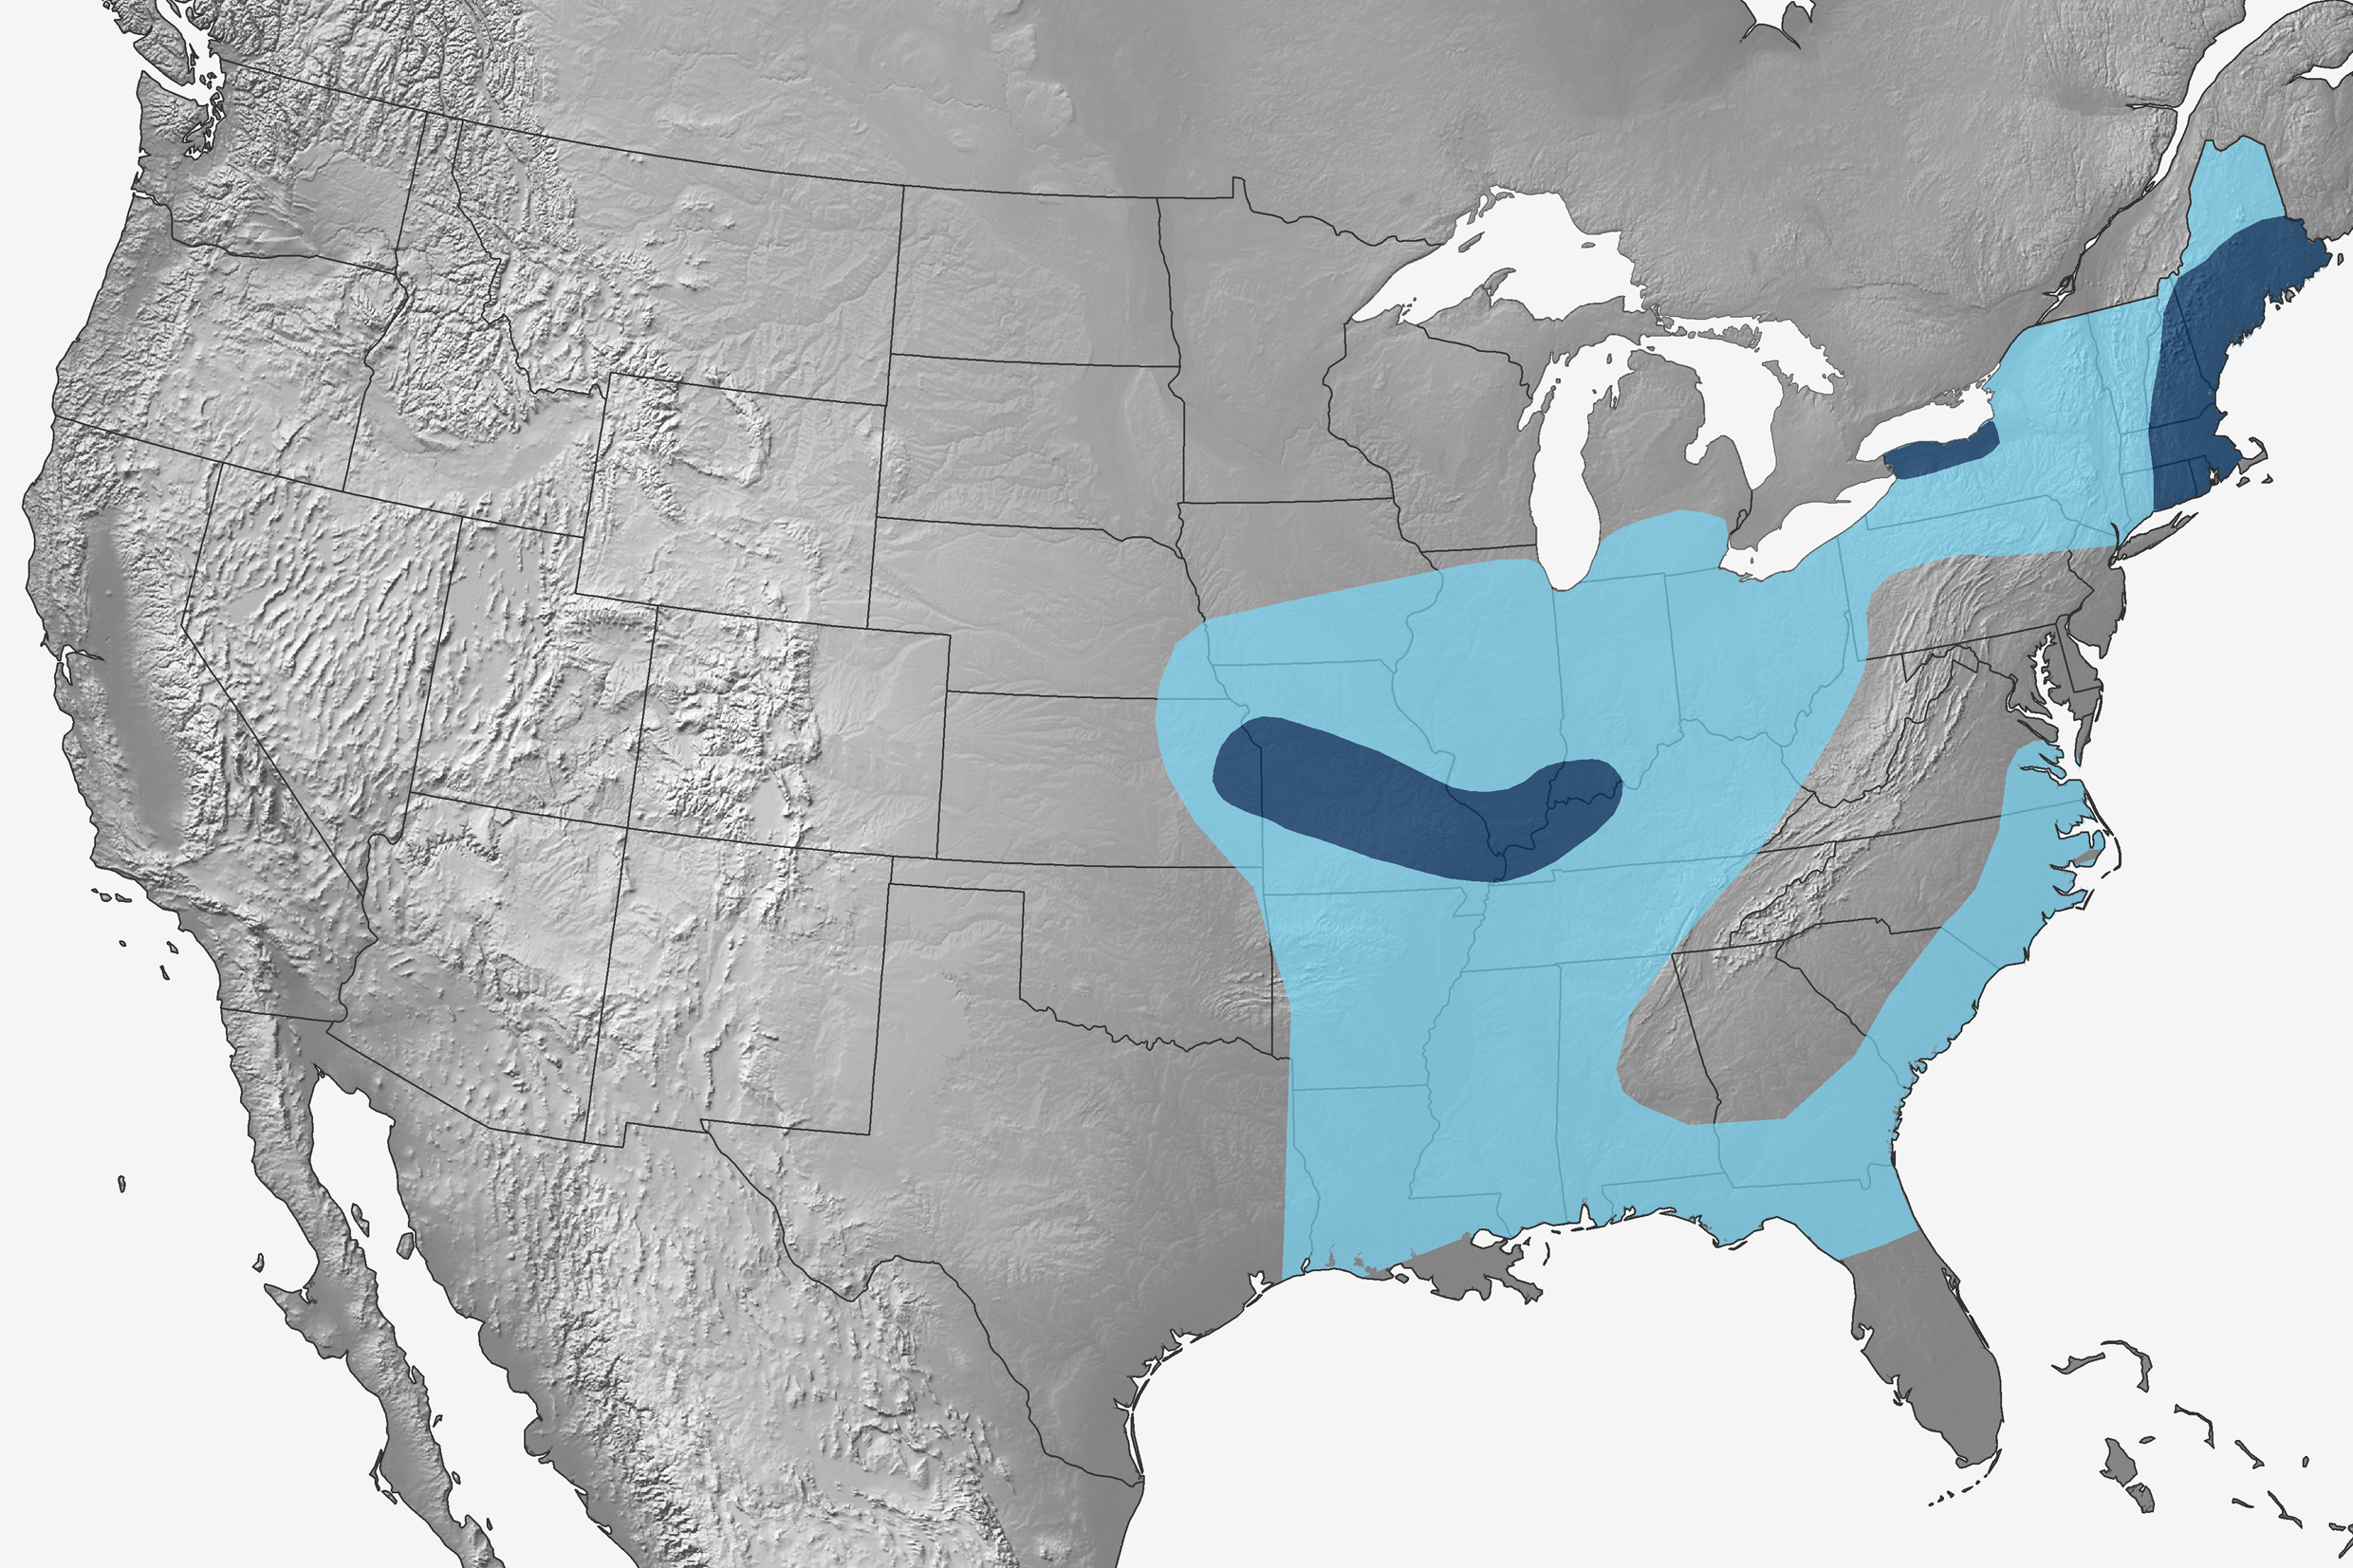
According to NOAA’s Spring Outlook released today, rivers in western New York and eastern New England have the greatest risk of spring flooding in part because of heavy snowpack coupled with possible spring rain. Meanwhile, widespread drought conditions are expected to persist in California, Nevada, and Oregon this spring as the dry season begins.
“Periods of record warmth in the West and not enough precipitation during the rainy season cut short drought-relief in California this winter and prospects for above average temperatures this spring may make the situation worse,” said Jon Gottschalck, chief, Operational Prediction Branch, NOAA’s Climate Prediction Center.
NOAA’s Spring Outlook identifies areas at risk of spring flooding and expectations for temperature, precipitation and drought from April through June. The Spring Outlook provides emergency managers, water managers, state and local officials, and the public with valuable information so they will be prepared to take action to protect life and property.
Additional map sizes & formats
Flood risk

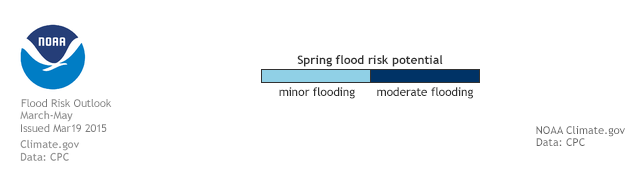
This map shows where there is a greater than 50% chance of river levels meeting or exceeding minor (light blue) or moderate (dark blue) flood stage. Minor means minimal or no property damage, but possibly some public threat, such as flooded roads. Moderate means some inundation of structures and roads near streams or rivers, along with some some evacuations of people and/or transfer of property to higher elevations. Map by NOAA Climate.gov, based on data from the National Weather Service. additional formats print quality version | legend
April-June temperature outlook

U.S. locations where odds are better than 33% that a region will experience well above (red) or well below (blue) average temperatures for April-June. Well above/below means "in the upper or lower third of historical values for a given location." Regions colored white have equal chances (33% each) for above-, below-, or near-average temperatures. Map by NOAA Climate.gov, based on data from CPC.
April-June precipitation outlook

U.S. locations where odds are better than 33% that a region will experience well above (green) or well below (brown) average precipitation for April-June. Well above/below means "in the upper or lower third of historical values for a given location." Regions colored white have equal chances (33% each) for above-, below-, or near-average precipitation. Map by NOAA Climate.gov, based on data from CPC.
April-June drought outlook

Predicted change in drought conditions across the United States for April-June 2015. Maps by NOAA Climate.gov, based on data provided by CPC.
Where this page came from
This page was imported from NOAA Climate.gov. Published by NOAA Climate.gov, which lets anything credited to it be re-used with attribution; material credited to others is left out.
Nobody has written it yet — it is the source material at a new address, which is why search engines are asked to skip it and why no one earns from it. It is up for grabs: take it on, and it is yours to rewrite and to earn from.
Licence: CC0 1.0 (public domain) · Adapted from www.climate.gov
1
0
0
0

Comments