

Trees along the river make a buffer that softens the urban skyline and helps reduce the "heat island" effect of pavement. NPS photo / T. Gostomski.
Forest harvest, blowdowns, fire and development leave patches on a landscape that change how its ecosystems and watersheds are built and how they work. Knowing when, where, how large and how intense those disturbances are helps resource managers weigh their options.
The National Park Service's Great Lakes Inventory and Monitoring Network tracks landscape change in and around Mississippi National River and Recreation Area (MISS) with an automated satellite change-detection program called LandTrendr. Its second report for the park analysed 30 years of satellite imagery, 1990–2019, over the park and three sub-watersheds of the Mississippi River — 185,690 hectares (458,849 acres) in all, 16,085 ha (39,746 acres) of it inside the park boundary.
Thirty years of growth
For those 30 years the dominant disturbance was development: wider roads, and green space turned into business parks and single-family homes.
- Outside the park, much of it came in the 1990s, peaking in 1996 and — slightly lower — again in 2000. Development made up 99 percent of all disturbance there: 14,686 ha (36,289 acres), or 489.53 ha (1,209 acres) a year.
- Inside the park, a low but steady tide of development was broken by three small peaks, the largest in 2000. In all, 307 ha (758 acres) were developed, 10.23 ha (25 acres) a year.
Forest harvest and windstorms are passing disturbances. Development is cumulative and permanent: it has been shown to affect water quality in streams, rivers and lakes, and it amplifies a warming climate by making the metro area a heat island.
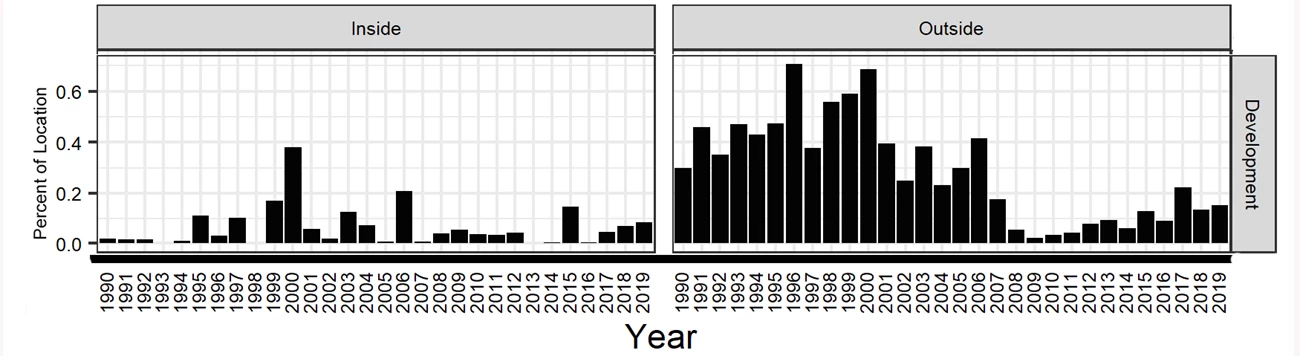
Share of the study area affected by development inside and outside Mississippi National River and Recreation Area, 1990–2019.

Types of landscape disturbance (left) and the year each happened (right), within the park and three sub-watersheds of the Mississippi River in the Twin Cities metro area.
Heat islands
Buildings and roads absorb and re-emit the sun's heat more than forests and water do, so many cities become islands of higher temperature compared with the land around them. The U.S. Environmental Protection Agency reports that U.S. studies have found urban areas about 1–7 °F warmer by day, and about 2–5 °F warmer at night, than outlying areas.

Surface temperatures vary more than air temperatures by day but are much alike at night. The dips and spikes over the pond show how water keeps a nearly constant temperature, because it does not absorb the sun's energy the way buildings and pavement do. Parks, open land and water make cooler areas within a city, and temperatures are usually lower at the suburban–rural edge than downtown. Diagram: U.S. Environmental Protection Agency.
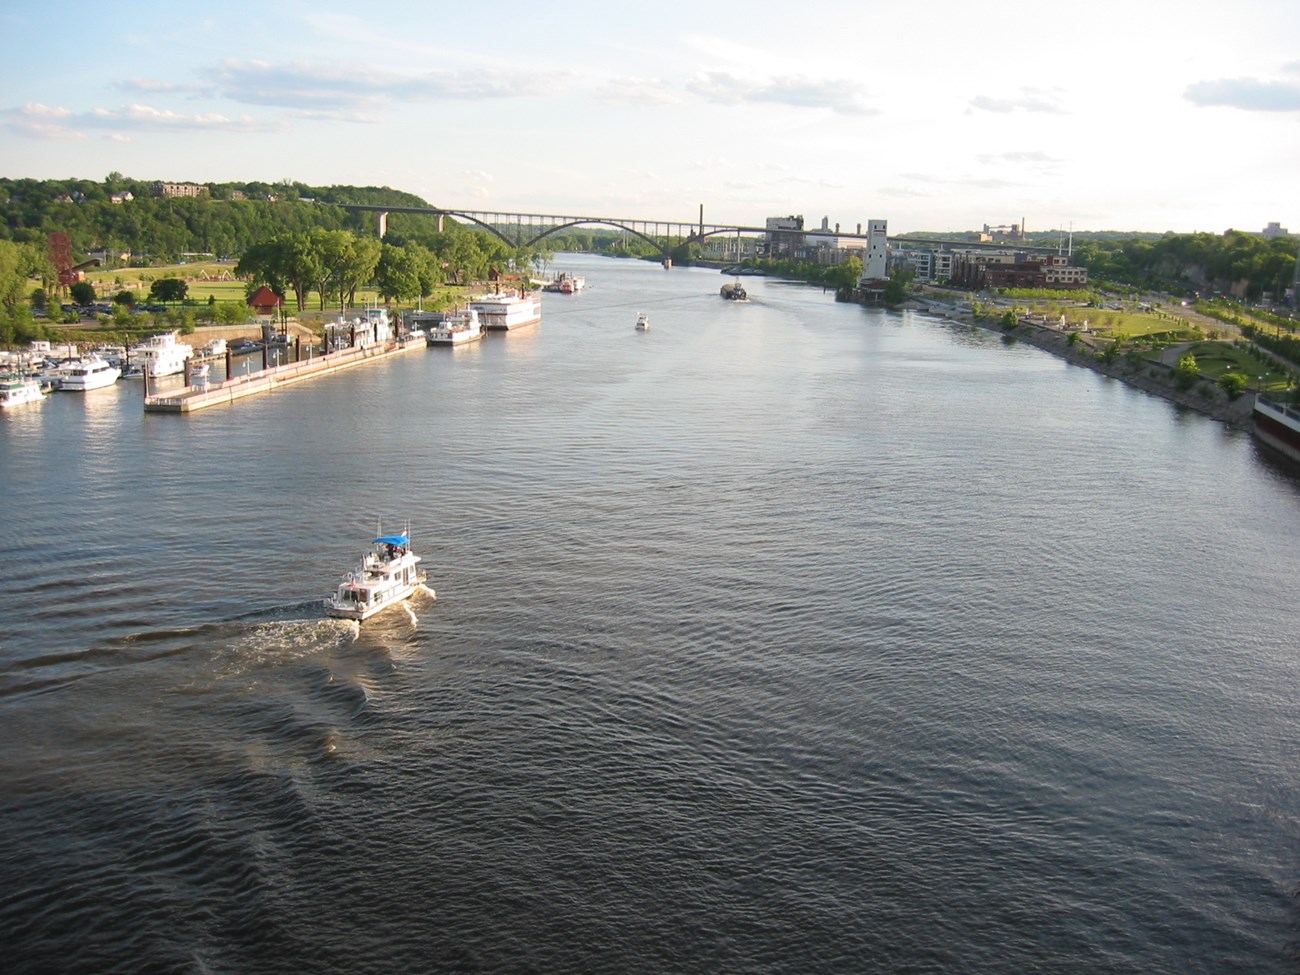
Bridges, buildings, parks and the river. NPS / T. Gostomski.
Looking ahead
As in the network's other parks, there has been relatively little disturbance inside MISS's boundary. In an urban landscape, the string of parks and natural areas along the river gives plants, wildlife and the people of the metro area important habitat and refuge. Continued monitoring will show how the changing landscape may affect water quality, wildlife corridors and the heat island along the river in the Twin Cities.
Sources
- National Park Service, Great Lakes Inventory and Monitoring Network, "Landscape Change Along the Upper Mississippi, 1990-2019." https://www.nps.gov/articles/000/landscape-change-along-the-upper-mississippi-1990-2019.htm
- The report: Kirschbaum, A.A. 2022. Landsat-based monitoring of landscape dynamics at Mississippi National River and Recreation Area: 1990–2019. Natural Resource Data Series NPS/GLKN/NRDS—2022/1383. National Park Service, Fort Collins, Colorado. https://doi.org/10.36967/2296636
- U.S. Environmental Protection Agency, "Learn About Heat Islands." https://www.epa.gov/heatislands/learn-about-heat-islands
- Landscape dynamics monitoring: https://www.nps.gov/im/glkn/landscape-dynamics.htm
- Rewritten in hubnx's own words.
In these publicationsMississippi National River & Recreation Area
Licence: CC0 1.0 (public domain) · Adapted from www.nps.gov
1
0
0
0

Comments


