Workers employed in travel, tourism and outdoor recreation at the beginning of the second quarter of 2020 also experienced significant earnings losses during the quarter (up to 40%) compared to those employed at the start of the second quarter of 2019.
Not surprisingly, regions with the most severe COVID-19 outbreaks and largest share of tourism jobs were disproportionately affected at the start of the pandemic and the Census Bureau’s Quarterly Workforce Indicators (QWI) show the extent of the employment and earnings impacts from state to state.
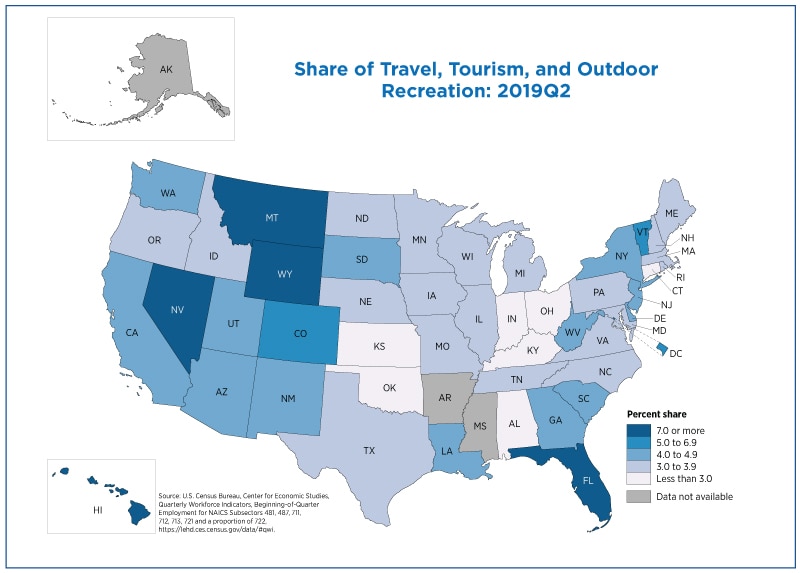
Travel, tourism and outdoor recreation jobs make up approximately 4%-5% of total private employment in most states. However, Hawaii and Nevada are outliers with much larger shares of 14.4% and 21.0% in the second quarter of 2019, respectively.
In addition to Nevada and Hawaii, Wyoming (7.3%), Montana (7.2%), and Florida (7.1%) make up the five states with the largest employment share in travel, tourism, and outdoor recreation.
Drop in Tourism at Onset of Pandemic
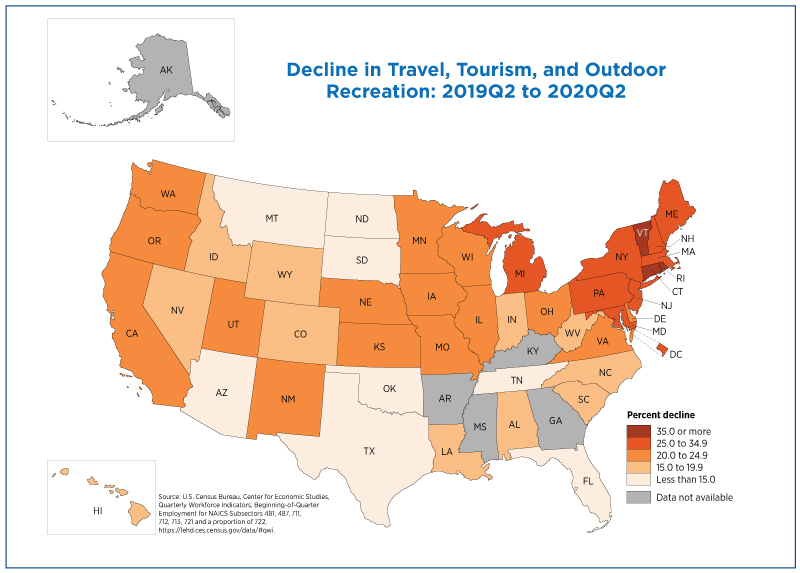
QWI data can be used to show year-over-year changes in travel, tourism and outdoor recreation employment. Note that we calculate year-over-year changes rather than quarterly changes due to the seasonality of these industries.
The states with the greatest declines in travel, tourism and outdoor recreation employment were Rhode Island (decline of 37.9%), Vermont (37.4%), Connecticut (36.4%), Massachusetts (32.1%), New York (31.5%), and Washington (24.9%).
These states reflect locations of initial outbreaks at the start of the pandemic and the disproportionate impact it had on and travel and tourism in these areas.
Earnings Losses in Tourism Jobs
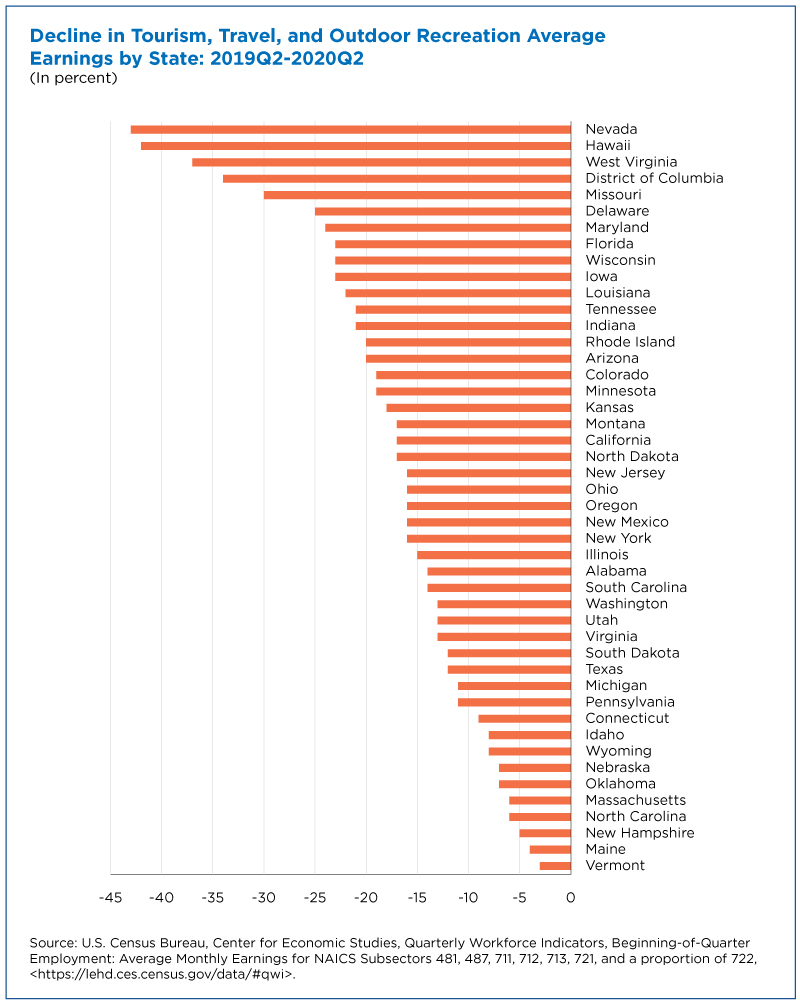
Workers employed in travel, tourism and outdoor recreation at the beginning of the second quarter of 2020 also experienced significant earnings losses during the quarter (up to 40%) compared to those employed at the start of the second quarter of 2019.
These earnings losses reflect lost hours or weeks of work during the quarter as well as any layoffs later in the quarter. Again, impact on earnings varied widely across states.
States that saw the largest earnings decreases among these workers were Nevada (decline of 42.9%), Hawaii (41.9%), West Virginia (37.5%), the District of Columbia (34.3%), and Missouri (30.3%).
States with the largest employment losses, however, were not always the same states that saw the largest percentage earnings declines during this time period.
Female Workers More Affected
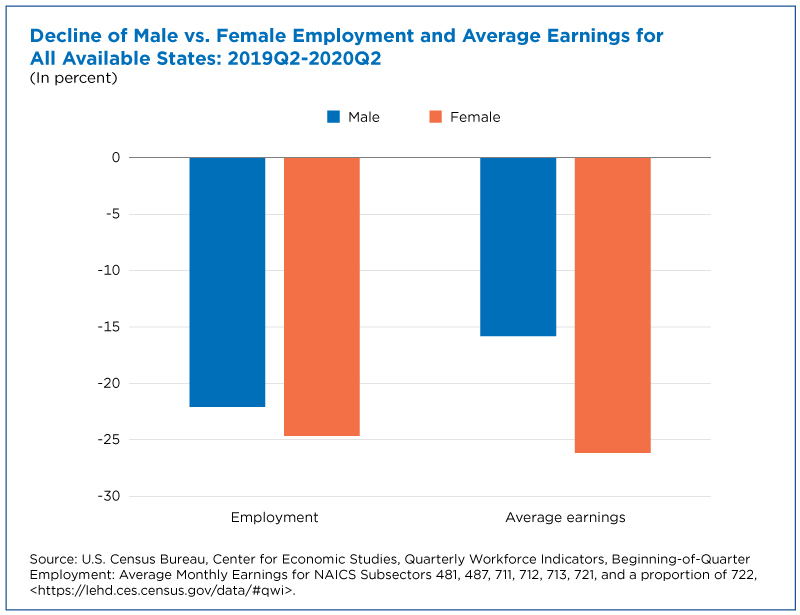
Women were more likely to lose either employment or earnings in the second quarter of 2020 relative to other workers in the industry.
Nationally, the share of female employment in travel, tourism and outdoor recreation was just over 50%, with some variation across states. However, women experienced larger employment and earnings declines than men.
Notably, the decline in average earnings for women was considerably more pronounced than the decline in employment at the beginning of the quarter.
Women accounted for well over 50% of travel, tourism and outdoor recreation job losses in most states and for more than 60% of employment losses in several states. ****
More Jobs, Earnings Losses for Young Workers
Young workers were more likely to lose either employment or earnings in the second quarter of 2020 relative to other workers in the industry.
The largest declines in both employment and earnings in these industries were among workers younger than 25 years old.
These young workers accounted for just under 20% of national employment in travel, tourism and outdoor recreation with some variation across states. Yet they typically accounted for a larger fraction of employment declines in some states.
In Florida, Pennsylvania, Texas and Virginia, for example, young workers accounted for up to 35% of the total decline in travel, tourism, and outdoor recreation employment. But they made up a smaller share of employment losses in Western states.
****
Workforce Dynamics Resources
The Center for Economic Studies (CES) manages the Local Employment Dynamics (LED) Partnership, a voluntary federal-state partnership that merges worker and employer data to produce enhanced labor market statistics used to research and report workforce dynamics.
In addition to the Quarterly Workforce Indicators (QWI), LED Partnership data include the Job-to-Job Flows (J2J), Post-Secondary Employment Outcomes (PSEO) and LEHD Origin-Destination Employment Statistics (LODES).
All are accessible online for public use at lehd.ces.census.gov/data/. The QWI, J2J, PSEO, and LODES data can be analyzed interactively in the QWI Explorer, J2J Explorer, PSEO Explorer and OnTheMap applications, respectively.
Matthew Graham and Heath Hayward are geographers and application developers in the Census Bureau’s Center for Economic Studies (CES). Hubert Janicki, Lee Tucker and Erika McEntarfer are economists in CES.
Where this page came from
This page was imported from U.S. Census Bureau. Published by the U.S. Census Bureau and, as a work of the United States government, in the public domain; material credited to others is left out.
Nobody has written it yet — it is the source material at a new address, which is why search engines are asked to skip it and why no one earns from it. It is up for grabs: take it on, and it is yours to rewrite and to earn from.
Licence: CC0 1.0 (public domain) · Adapted from www.census.gov
1
0
0
0

Comments