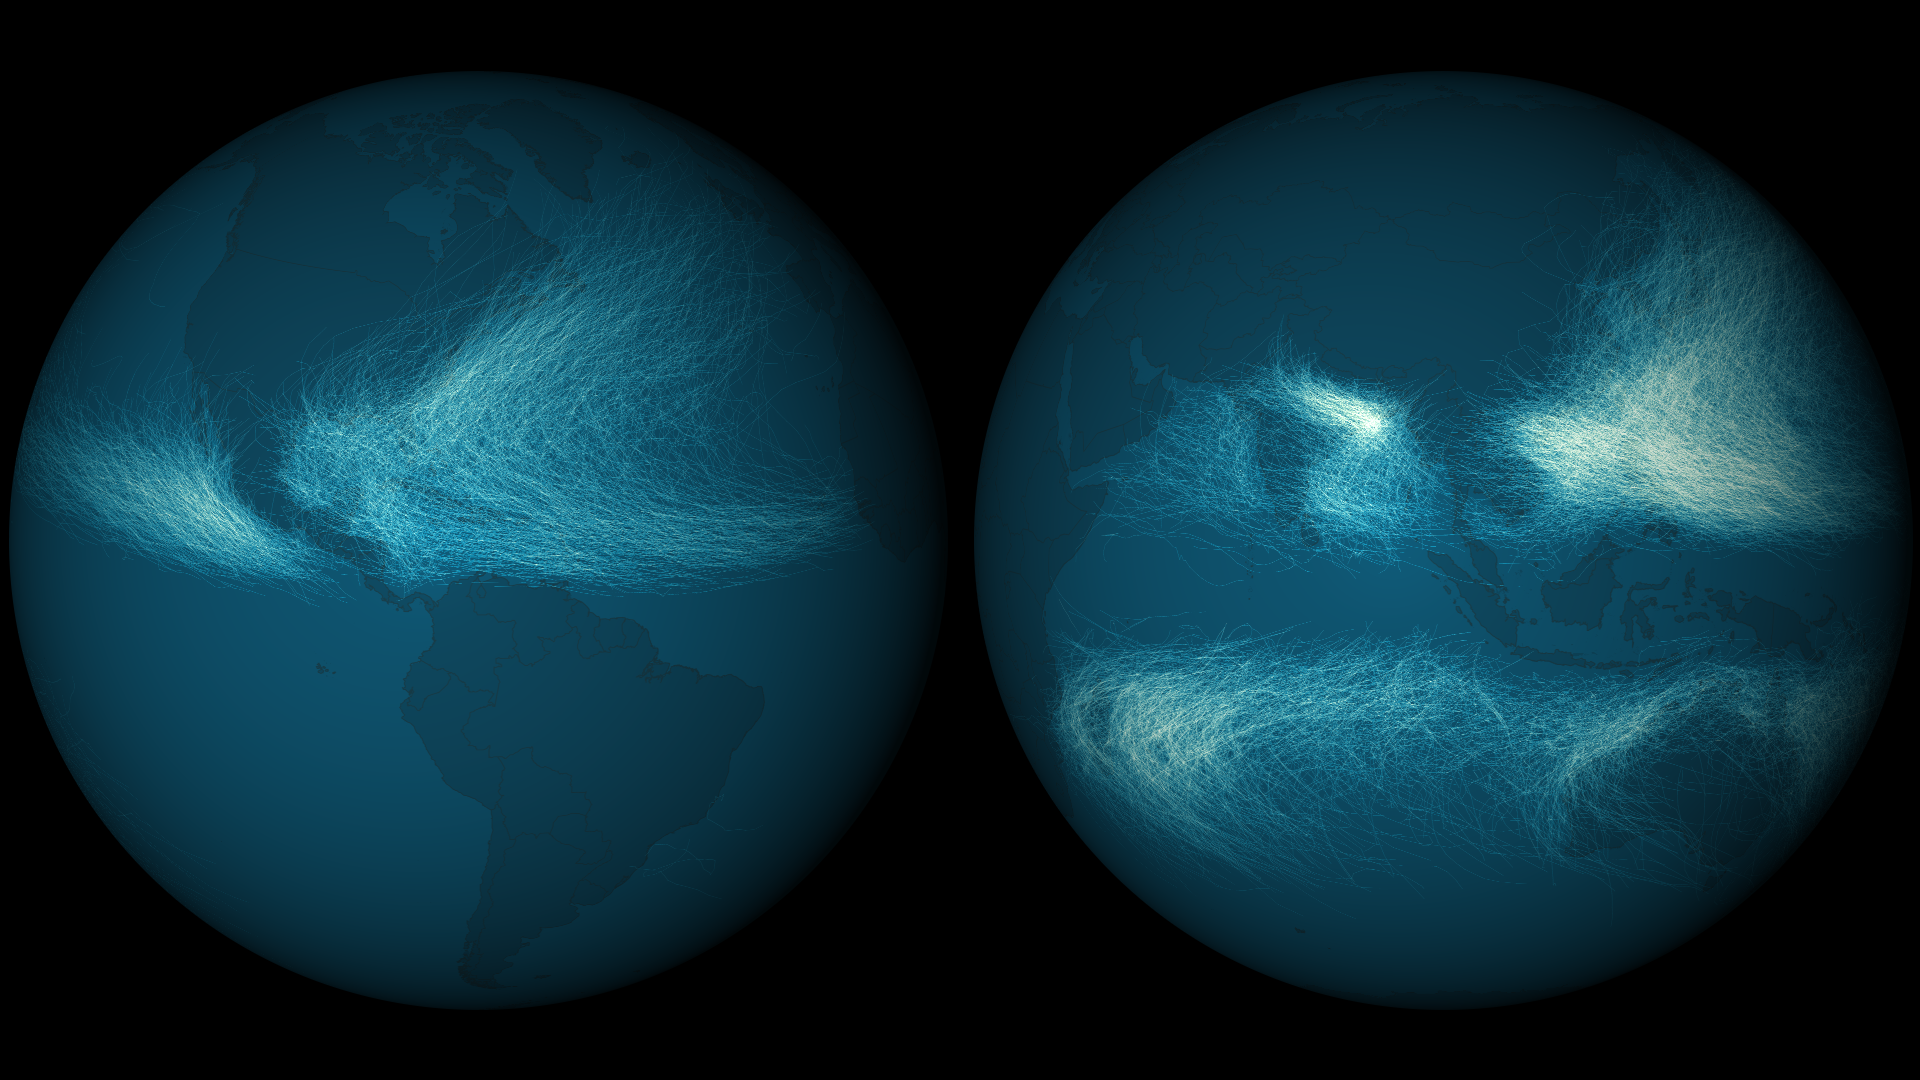
Download Image Download Image of cyclones paths.
Tropical cyclones form in most ocean basins – some more frequently than others. Before the advent of the satellite era, hurricane tracks were constructed from ship reports – and although reliable, some storms were probably missed. Geostationary satellites, such as NOAA’s GOES, revolutionized the ability of meteorologists to track cyclones. Not a single storm is missed as these eyes in the sky provide consistent scans of the globe every few minutes. NOAA’s National Climatic Data Center has assembled the best track data for 11,967 tropical cyclones into a single database, called IBTrACS, with information from 1842 to 2012. This image shows the output of that data. By coloring how many times any storm track overlapped another, certain patterns arise in the density of storms affecting a given area. Cyclone tracks overlapped the most in the western Pacific and Bay of Bengal (India), where typhoon season never ends since waters are always warm enough to sustain cyclone formation. The frequency of track overlaps is much lower in the Western Hemisphere than in the Eastern Hemisphere.
Where this page came from
This page was imported from NOAA Satellites (NESDIS). Published by NOAA's National Environmental Satellite, Data, and Information Service and, as a work of the United States government, in the public domain; pictures credited elsewhere are left out.
Nobody has written it yet — it is the source material at a new address, which is why search engines are asked to skip it and why no one earns from it. It is up for grabs: take it on, and it is yours to rewrite and to earn from.
Licence: CC0 1.0 (public domain) · Adapted from www.nesdis.noaa.gov
1
0
0
0

Comments