
—by Mandy L. Stone, Jennifer L. Graham, and Andrew C. Ziegler
Cheney Reservoir, located on the North Fork Ninnescah River in south-central Kansas (fig. 1), is the primary water supply for the city of Wichita and an important recreational resource. Concerns about taste-and-odor occurrences in Cheney Reservoir have drawn attention to potential pollutants, including total phosphorus (TP) and total suspended solids (TSS). July 2009 was the 15th anniversary of the establishment of the Cheney Reservoir Watershed pollution management plan. The U.S. Geological Survey (USGS), in cooperation with the city of Wichita, has collected water-quality data in the basin since 1996, and has monitored water quality continuously on the North Fork Ninnescah River since 1998. This fact sheet describes 12 years (1997–2008) of computed TP and TSS data and compares these data with water-quality goals for the North Fork Ninnescah River, the main tributary to Cheney Reservoir.


Introduction
Cheney Reservoir provides about 70 percent of the city of Wichita’s water supply (Christensen and others, 2006). The Cheney Reservoir Basin covers 933 square miles and predominantly is agricultural, and agricultural activities account for about 65 percent of the phosphorus transported into Cheney Reservoir (Pope and others, 2002). The North Fork Ninnescah River contributes about 70 percent of the water flowing into the reservoir; however, there also are several small contributing tributaries (Christensen and others, 2006).
In response to 1990 to 1991 cyanobacterial-related tasteand-odor occurrences, a task force was formed in 1992 to prepare a pollution management plan to identify and mitigate sources of water pollution in the Cheney Reservoir Watershed. The Cheney Reservoir Task Force identified TP and TSS, indicative of suspended-sediment concentrations, as primary pollutants of concern because of their relation to taste-and-odor producing cyanobacterial blooms. Consequently, mean stream water-quality goals for TP and TSS during base-flow, runoff, and long-term streamflow conditions were established (table 1) (Cheney Reservoir Task Force, 1994). TP goals were set at a similar standard as the State of Kansas for long-term stream water quality, and TSS goals were established to extend the life of Cheney Reservoir from 130 to 200 years (Cheney Reservoir Task Force, 1994). From 1994 to 2009, approximately 1,500 best management practice (BMP) contracts have been implemented in the Cheney Reservoir Basin (Cheney Reservoir Citizens Management Committee, written commun., 2009) and Conservation Reserve Program land has increased by approximately 69,684 acres (Starzec and others, 2008).
Approach
- Streamflow has been measured continuously on the North Fork Ninnescah River above Cheney Reservoir (USGS streamflow-gaging station 07144780) since July 1965, and water-quality sensors (specific conductance, pH, water temperature, turbidity, and dissolved oxygen) have been operated continuously since October 1998. Collection of discrete and continuous water-quality data currently (2009) is scheduled to continue until 2015.

U.S. Geological Survey streamflow-gaging station. Photograph by Jennifer Graham, U.S. Geological Survey.
- TP and TSS concentrations in the North Fork Ninnescah River above Cheney Reservoir have been computed using continuous data for the past 12 years (1997–2008) based on regression equations developed from discrete water-quality samples. TP and TSS concentrations during 1997 and 1998 were computed based on regression models using streamflow (Pope and Milligan, 2000). During 1999 to 2008, regression equations were used to compute TP concentrations based on streamflow and turbidity, and TSS concentrations based on turbidity (Christensen and others, 2006).
- Base-flow and runoff conditions were defined for each year based on annual discharge duration curves with a 10 percent flow separation point.
- All data are available on the World Wide Web at http:// ks.water.usgs.gov/ and http://nrtwq.usgs.gov/ks
Results Streamflow
- During 1997 to 2008 there were only two 50 percent exceedance floods (statistically, floods will occur every 2 years), which occurred in 2000 and 2007.
- In all years, mean annual streamflow was similar to or below the long-term average (fig. 2).
- 2006 was one of the driest years on record—it had the third lowest annual flow for the period of record, and the lowest annual flow since 1972.
Total Phosphorus
- Computed mean annual TP concentrations for the North Fork Ninnescah River ranged from 0.114 to 0.215 milligram per liter during 1997 to 2008 (fig. 2).
- Computed mean base-flow and annual TP concentrations exceeded the base-flow goal of 0.05 milligram per liter and the long-term goal of 0.1 milligram per liter each year (fig. 2). Mean annual runoff TP concentrations never exceeded the runoff goal of 0.4 milligram per liter (fig. 2); hourly values indicate that the runoff goal was exceeded about 2 percent of the time during 1997 to 2008.
- During extreme low-flow conditions in 2006, the mean annual base-flow TP concentration was more than double the base-flow goal and approximately 10 percent greater than the long-term goal.
- Estimated annual TP yields ranged from 15 to 100 pounds per square mile, and generally were largest in years with the largest mean annual streamflow (figs. 2 and 3).

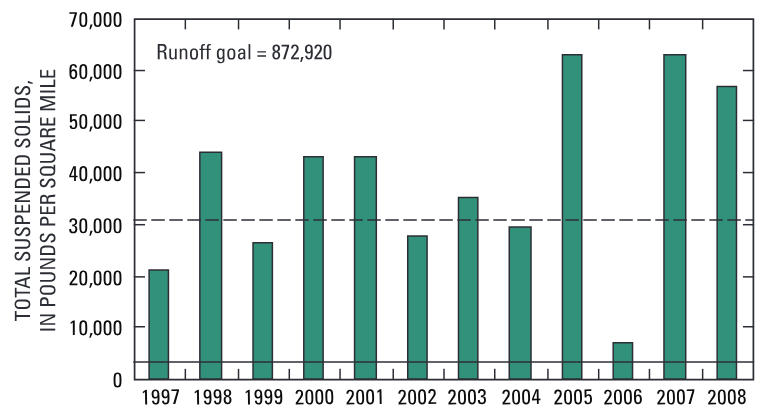

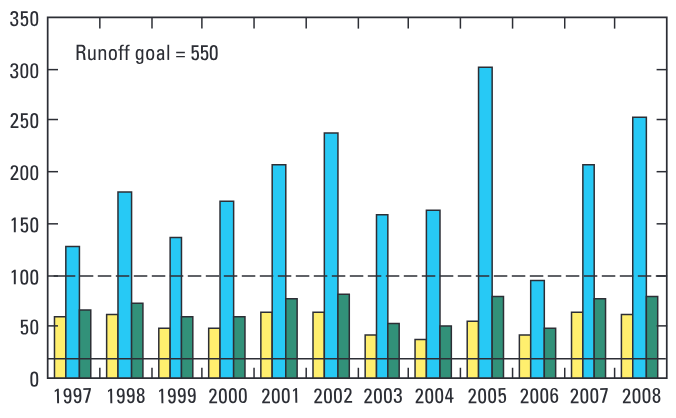
EXPLANATION Goal Base-flow Base-flow Runoff Runoff Annual Long-term
Total Suspended Solids
- Computed mean annual TSS concentrations for the North Fork Ninnescah River ranged from 48 to 81 milligrams per liter during 1997 to 2008 (fig. 2).
- Computed mean base-flow and annual TSS concentrations exceeded the base-flow goal of 20 milligrams per liter each year, but not the long-term goal of 100 milligrams per liter (fig. 2). Mean annual runoff TSS concentrations never exceeded the runoff goal of 550 milligrams per liter, and hourly values indicate that the runoff goal was exceeded less than 1 percent of the time during 1997 to 2008.

- Estimated annual TSS yields within the North Fork Ninnescah River Basin ranged from 8,000 to 63,000 pounds per square mile, and generally were largest in years with the largest mean annual streamflow (figs. 2 and 3).
- During extreme low-flow conditions in 2006, the average annual TSS concentration was more than double the base-flow goal.
- Streamflow in most years during 1997 to 2008 was less than the long-term average and large flood events did not occur. Future TP and TSS concentrations and yields are likely to be more variable than observed during the dry period from 1997 to 2008.
- Based on 1997 to 2008 data, base-flow TP and TSS goals and long-term TP goals are not being met; however, long-term TSS and runoff TP and TSS goals were rarely exceeded.
- Decreases in annual TP and TSS concentrations in the North Fork Ninnescah River were not discernable during 1997 to 2008, due in part to large among-year hydrologic variability.
- Given that TP and TSS concentrations exceeded base-flow goals in 2006, an extremely dry year, the established base-flow goals may be unattainable or significantly more BMPs would be needed to attain them.
- About 76 percent of the sediment load to Cheney Reservoir comes from 10 percent of the basin (U.S. Department of Agriculture, 2006); therefore, focused BMP implementation in areas of the basin with the greatest impacts on loads may result in documentable decreases in TSS, and likely TP, concentrations in the North Fork Ninnescah River.
- The effects of BMP implementation on water quality in the North Fork Ninnescah River and Cheney Reservoir may not be evident for many years. Continued monitoring will allow documentation of changing water-quality conditions.
References
Cheney Reservoir Task Force, 1994, Watershed pollution management plan for North Fork Ninnescah Watershed and Cheney Reservoir, Final Report, 22 p.
Christensen, V.G., Graham, J.L., Milligan, C.R., Pope, L.M., and Ziegler, A.C., 2006, Water quality and relation to tasteand-odor compounds in the North Fork Ninnescah River and Cheney Reservoir, south-central Kansas, 1997–2003: U.S.
For more information concerning this publication, contact:
Or visit the Kansas Water Science Center Web Site at: Director
Kansas Water Science Center 4821 Quail Crest Place Lawrence, KS 66049 (785) 842–9909
http://ks.water.usgs.gov
Geological Survey Scientific Investigations Report 2006– 5095, 43 p.
Pope, L.M., and Milligan, C.R., 2000, Preliminary assessment of phosphorus transport in the Cheney Reservoir watershed, south-central Kansas, 1997–98: U.S. Geological Survey Water-Resources Investigations Report 2000–4023, 29 p.
Pope, L.M., Milligan, C.R., and Mau, D.P, 2002, Historical contributions of phosphorus from natural and agricultural sources and implications for stream water quality, Cheney Reservoir Watershed, south-central Kansas: U.S. Geological Survey Water-Resources Investigations Report 2002–4021, 25 p.
Starzec, K., French, L., Nelson, N., and Devlin, D., 2008, Conservation and citizen participation in the Cheney Lake watershed: Journal of Soil and Water Conservation, Nov/Dec 2008, 63(6), 4 p.
U.S. Department of Agriculture Natural Resources Conservation Service, 2006, Ephemeral gully erosion in Cheney Lake Watershed, Kansas: Natural Resources Conservation Service CEAP Conservation Insight, 4 p.
Where this page came from
This page was imported from U.S. Geological Survey. Published by the U.S. Geological Survey and, as a work of the United States government, in the public domain.
Nobody has written it yet — it is the source material at a new address, which is why search engines are asked to skip it and why no one earns from it. It is up for grabs: take it on, and it is yours to rewrite and to earn from.
Licence: CC0 1.0 (public domain) · Adapted from pubs.usgs.gov
1
0
0
0

Comments


