
2000 CONTENTS NATIONAL WATER-QUALITY ASSESSMENT PROGRAM
THIS REPORT summarizes major findings about water quality in the Kanawha–New River Basin that emerged from an assessment conducted between 1996 and 1998 by the U.S. Geological Survey (USGS) National Water– Quality Assessment (NAWQA) Program. Water quality is discussed in terms of local and regional issues and compared to conditions found in all 36 NAWQA study areas, called Study Units, assessed to date. Findings also are explained in the context of selected national benchmarks, such as those for drinking-water quality and the protection of aquatic organisms. The NAWQA Program was not intended to assess the quality of the Nation’s drinking water, such as by monitoring water from household taps. Rather, NAWQA assessments focus on the quality of the resource itself, thereby complementing many ongoing Federal, State, and local drinking-water monitoring programs. Comparisons made in this report to drinking-water standards and guidelines are only in the context of the available untreated resource. Finally, this report includes information about the status of aquatic communities and the condition of instream habitats as elements of a complete water-quality assessment.
Many topics covered in this report reflect the concerns of officials of State and Federal agencies, water-resource managers, and members of stakeholder groups who provided advice and input during this water-quality assessment. Residents of West Virginia, Virginia, and North Carolina who wish to know more about water quality in the areas where they live will find this report informative as well.

THE NAWQA PROGRAM of the USGS seeks to improve scientific and public understanding of water quality in the Nation’s major river basins and ground-water systems. Better understanding facilitates effective resource management, accurate identification of water-quality priorities, and successful development of strategies that protect and restore water quality. Guided by a nationally consistent study design and shaped by ongoing communication with local, State, and Federal agencies, NAWQA assessments support the investigation of local issues and trends while providing a firm foundation for understanding water quality at regional and national scales. The ability to integrate local and national scales of data collection and analysis is a unique feature of the USGS NAWQA Program.
The Kanawha–New River Basin is one of 51 water-quality assessments initiated since 1991, when the U.S. Congress appropriated funds for the USGS to begin the NAWQA Program. As indicated on the map, 36 assessments have been completed, and 15 more assessments will conclude in 2001. Collectively, these assessments cover about one-half of the land area of the United States and include water resources that are available to more than 60 percent of the U.S. population.
IV National Water-Quality Assessment Program
SUMMARY OF MAJOR FINDINGS

The generally low population and intensity of agriculture and urban land uses throughout the Kanawha–New River Basin are reflected in low concentrations of nutrients and pesticides in streams and rivers.
Streams in the coal region of the Appalachian Plateaus Physiographic Province generally improved between about 1980 and 1998 with respect to pH, total iron, total manganese, and sedimentation. These improvements were among the regulatory goals of the Surface Mining Control and Reclamation Act of 1977 (SMCRA). Other unregulated factors, however, show the effects of continued mining. Mine drainage in the basin is rarely acidic but has high concentrations of sulfate, which decrease slowly after mining ends. Stream-bottom sedimentation in mined basins remains greater than in undisturbed basins.
Summary of Major Findings 1


Major Influences on Ground Water • Composition of soils and bedrock • Improper disposal of human and animal wastes • Current and past mining practices • Pesticide usage and other toxic chemical releases
Ground-Water Highlights
Ground water in the Appalachian Plateaus and Blue Ridge Physiographic Provinces moves mostly in a network of narrow fractures within a few hundred feet of the land surface, and drains toward the nearest stream. Wells normally tap only a few of the many local fractures. The ridgetops bound each local aquifer, which generally are affected only by local contaminant sources. In small areas of the basin where caves and solution cavities in limestone bedrock are common, wells can have high yields but are susceptible to contamination from fecal bacteria, pesticides, and other toxic chemicals.
Water Quality in the Kanawha–New River Basin
Population and Human Activities
The Kanawha River and its major tributary, the New River, drain 12,223 miin North Carolina, Virginia, and West Virginia (Messinger and Hughes, 2000). Most of the total basin population of 870,000 (1990 data) live in rural areas, and industrial and residential areas cover less than 5 percent of the total area in the basin (fig. 1). Only about 30 percent of the population live in towns larger than 10,000 people, including the 25 percent who live in the Charleston, W. Va., metropolitan area. The total population has not changed substantially since the 1950s, mostly because of emigration from rural parts of the basin to urban centers in the Midwest and the South.
The only major industrial area in the basin is along the terrace of the Kanawha River, within about 20 miles of Charleston (fig. 2). Chemical industry practices that profoundly polluted the Kanawha River during the 1950s and 1960s have changed, and discharge of pollutants to streams has greatly decreased, although
Introduction to the Kanawha–New River Basin bed sediment and fish remain contaminated with dioxin and other industrial chemicals (Henry, 1981; Kanetsky, 1988; West Virginia Division of Environmental Protection, 2000).
In the Kanawha–New River Basin, most coal is mined in the Appalachian Plateaus in West Virginia (McColloch, 1998). About 7 percent of the coal mined in the United States comes from the Kanawha–New River Basin (Fedorko and Blake, 1998; Messinger and Hughes, 2000). Most coal mined in the basin has a low sulfur content. Coal production has increased since passage of the Clean Air Act amendments of 1990, which mandated a reduction of sulfate emissions to decrease acid precipitation.
Physiography
The streams and rivers of the basin drain areas in three physiographic provinces: the Blue Ridge (17 percent), the Valley and Ridge (23 percent), and the Appalachian Plateaus (60 percent). In the Appalachian Plateaus, little of the land is flat, and most flat land is in the flood plains and terraces of streams. The Valley and Ridge is characterized by strongly folded ridges separated by relatively flat, broad valleys. These two regions are underlain by sedimentary rocks. The Blue Ridge is characterized by igneous and metamorphic rocks that have been folded and faulted.

Figure 2. Coal and motor fuel commonly are transported by barge on the Kanawha River, downstream from Kanawha Falls.
Water Use
In 1995, 61 percent of the basin’s population depended on surface-water supplies for domestic needs (Solley and others, 1998). Thirty percent relied on domestic water wells. The remaining nine percent used public-supply water wells. In 1995, total withdrawal of water was about 1,130 Mgal/d (million gallons per day); total consumptive use was about 118 Mgal/d.
Hydrologic Conditions and Features
With some exceptions, mean streamflow during the study was within about 10 percent of long-term mean flows at most gaging stations (see records from a representative station in fig. 3). Major flooding occurred throughout the Appalachian Plateaus in January 1996, seven months before sampling began, and streamflow at several gaging stations within the Kanawha–New River Basin exceeded the 100-year flood flow (Ward and others, 1997). A thunderstorm in June 1998 caused flooding in the northwestern part of the basin where flow on a few small streams exceeded the 100-year recurrence interval (Ward and others, 1999). With the exception of these floods, no other flows exceeded the 10-year recurrence

Figure 3. After a major flood in January 1996, streamflow from Williams River at Dyer, W. Va., and precipitation from Richwood, W. Va., were normal throughout the study period. The long-term average annual streamflow at Williams River at Dyer, W. Va. is 336 cubic feet per second. Long-term average precipitation at the Richwood, W. Va. location is 48 inches per year.
Water Quality in the Kanawha–New River Basin interval. No streams in the basin were in drought conditions during the study.
Streamflow varies most through the year in the western Appalachian Plateaus, and it varies least through the year in the Blue Ridge. On average, streamflow throughout the basin is greatest in February and March and least in September through October. Maximum streamflow does not coincide with maximum precipitation because summer vegetation uses a large fraction of the precipitation.
The river system in the Kanawha–New River Basin is regulated by four major flood-control dams, three navigation dams, and several smaller dams. The two largest dams are on the Gauley River (Summersville Dam) and Elk River (Sutton Dam). The other two major dams are on the New River. The navigable reach of the Kanawha River is in backwater caused by the navigation dams. In this reach, stream depth is greater and velocity is less than in the undammed reaches of the major rivers. All pools behind dams in the basin collect sediment. Dams are also major barriers to fish movement.
Persistent Changes in Water Chemistry and Aquatic Biology are Evident in Coal-Mined Areas
About 7 percent of all coal mined in the Nation comes from an area of 5,000 miin the Appalachian Plateaus part of the Kanawha–New River Basin. Production of the mostly low-sulfur coal nearly doubled from 1980 to 1998 as mining technology advanced, individual mines became larger, and employment decreased. Total production is about 90 million tons per year. A coal seam 1 foot thick and 1 mile square weighs about 1 million tons.
Most drainage basins within the coal region have been mined repeatedly as technology has advanced and economics have changed. Only three unmined basins greater than 10 miin the coal mining region were identified in this study. Among mined basins, cumulative coal production of less than 10,000 ton/miof coal during 1980–95 is low. Cumulative production in many basins ranged from 100,000 to 1,000,000 ton/mi.
Most water that drains from coal mines in the Kanawha–New River Basin is naturally neutral or alkaline rather than acidic.When iron pyrite in coal and adjacent rocks is exposed to air and water during mining, a series of chemical reactions produce dissolved iron and sulfuric acid (Rose and Cravotta, 1998). Natural or applied limestone, lye, or anhydrous ammonia can neutralize the acid (Skousen and others, 1998), but sulfate ions dissolved in water generally remain as evidence of the reactions. Sulfate concentrations in streams decrease slowly after mining ends (Sams and Beer, 2000).
Since 1981, Total Iron and Manganese have Decreased in Stream Basins where Coal Mining has Continued, but Sulfate has Increased
During low flow in July 1998, water samples from 57 wadeable streams (drainage area less than 1 to 128 mi) were analyzed once. Samples were collected from streams in the region of the Appalachian Plateaus where coal has been mined. At least three analyses were available for 51 of the sites for 1979–81, before the Surface Mining Control and Reclamation Act (SMCRA) affected regional water quality (Ehlke and others, 1982). Each 1998 analysis was compared to the one earlier analysis with the closest corresponding streamflow. Results were interpreted with respect to cumulative mining history and other land uses in each basin.
Median concentrations of total iron and total manganese were lower in 1998 than during 1979–81 in 33 basins that had been mined both before and after SMCRA, but sulfate concentration and specific conductance were higher (table 1). In 1998, median total manganese, specific conductance, sulfate, and pH were higher in 37 basins mined since 1980 than in 20 basins unmined since then; median total iron was lower in the mined basins, possibly reflecting aggressive treatment of permitted discharges.
At the time the SMCRA and subsequent regulations were established, acidification and subsequent increase in metal concentrations, but not sulfate concentration, were known to degrade stream quality. Regulations,

Figure 4. Sites with a low concentration of sulfate drained basins with little recent coal production. Sites with a high concentration of sulfate drained basins with a wide range of recent coal production.
Major Findings 5 therefore, were targeted at decreasing mining-related acidification and concentrations of iron and manganese, but were not designed to decrease sulfate concentrations. Sulfate concentrations less than 59 mg/L (milligrams per liter; study median) were measured only from basins where less than 142,000 ton/miof coal were produced during 1980–95 (figs. 4 and 5). In contrast, manganese concentrations less than 32 μg/L (micrograms per liter; study median) were measured at several heavily mined basins (fig. 6).
Sulfate concentration in streams draining mined areas does not correlate strongly with coal production because sulfate production depends on local geology, mining practice, and possibly results from activities in addition to mining. Sulfate concentration is higher than background, however, in basins with the greatest coal production. Background sulfate concentration was less than 25 mg/L in 16 of 20 basins not mined since 1980. In contrast, sulfate concentration was greater than 250 mg/L in 8 of 15 mined basins drained by streams tributary to the Coal River. The USEPA guideline for sulfate in drinking water is 250 mg/L.
For two years, water chemistry was analyzed monthly and at high flow at two streams in heavily mined basins, and at one stream where no coal had been mined since 1980. At the mined sites, sulfate, several other ions, and specific conductance decreased as streamflow increased; at the unmined site, major-ion concentrations were low at all flows (fig. 7). Dissolved iron and manganese concentrations were virtually unrelated to flow at all three sites. At both Peters Creek near
6 Water Quality of the Kanawha–New River Basin Lockwood and Clear Fork at Whitesville, specific conductance was correlated with sulfate concentration, and correlations were nearly as strong between specific conductance and dissolved calcium, magnesium, sodium, and chloride. The same patterns were found in data for the sites before the implementation of the SMCRA.

Figure 6. Concentrations of manganese in about half of the streams draining heavily mined basins were less than the study median.
Streamflow, water temperature, pH, and specific conductance were measured hourly at the two mined sites during the same two years. In the Coal River Basin at Clear Fork, sulfate concentration (estimated from the hourly specific conductance) exceeded the 250-mg/L guideline about 25 percent of the time. Sulfate concentrations across a range of flow at Clear Fork were at least 10 percent greater in 1998 than in 1979– 81.

Figure 7. The concentration of sulfate, like other major ions, decreased with flow at two heavily mined sites but was consistently low at a site with no recent mining (Clear Fork R = 0.90, Peters Cr R = 0.91, Williams River R = 0.11).
In the Kanawha–New River Basin, half of the coal comes from underground mines and half from surface mines. Surface subsidence is expected above longwall mines, which remove about 90 percent of a coal seam, but is less common above room-and-pillar mines that may remove only 60 percent. Surface mines, both smaller contour mines and larger mountaintop mines, can remove 100 percent of a series of seams. Surfacemine operators working in steep-slope areas cannot simply replace all waste-rock material within the boundaries of the mine sites, because broken rock takes more space than consolidated rock. The excess is placed in valleys as fill material where the land is flat enough to provide a stable foundation, but the valley fills greatly affect the stream environment (U.S. Environmental Protection Agency, 2000).
Stream Benthic-Invertebrate Communities are Impaired at Mined Sites
In all streams sampled that drain areas where large quantities of coal have been mined, the benthic-invertebrate community is impaired in comparison to rural parts of the study area where little or no coal has been mined since 1980 (fig. 8). Some streams in which the community is impaired drained areas that were not heavily mined.

Figure 8. Only sites with little recent coal production had healthy invertebrate communities as measured by low (favorable) scores on the Modified Hilsenhoff Biotic Index, although not all impaired sites were in areas of high coal production.
Invertebrate communities were sampled from riffles at 29 wadeable streams in areas of the Appalachian Plateaus where coal is or has been mined (Chambers and Messinger, 2001). The sites were separated into two groups by statistical comparison of species composition and abundance. Each group contained communities that were similar. The communities that included several insect taxa known for intolerance of fine sediment were identified as the less impaired group of sites. These taxa include Epeorus mayflies and Dolophilodes and Rhyacophila caddisflies (fig. 9). Epeorus is a genus of relatively large mayflies that cling to the bottom of large, loosely embedded rocks. Fine sediment can fill the openings in the stream bottom where they live. Caddisflies in the genus Dolophilodes spin finely meshed nets that can be clogged with silt. Rhyacophila are mobile predators typically found in clean, coolwater streams. These intolerant taxa were not present in the invertebrate communities at sites identified as poorer. In addition, scores from the MHBI (Modified Hilsenhoff Biotic Index; see glossary) and proportions of pollution-tolerant taxa from the midge family were significantly greater at the more impaired group of sites. The MHBI and other biological metrics are mathematical summaries of characteristics that change predictably in response to environmental stress. They are used to measure ecological health of a system (Karr and Chu, 1999).
Major Findings 7 Benthic invertebrates are sensitive indicators of many types of stream disturbance (Barbour and others, 1999). Because most have a life span of about a year and many remain in the same short section of stream during most of their lives, they are particularly well suited for assessments of short-term, local disturbances within a watershed. Fish, however, often move throughout a stream system, enabling them to seek refuge from such disturbances. An impaired invertebrate community is more than a disruption in the aquatic food web— it indicates that stream chemistry and (or) physical habitat are impaired. Stream-chemistry data provide useful information about the stream’s quality only for the time of sampling, but benthic-invertebrate communities can show the effects of short-term disturbances that can easily be missed when stream-quality assessments rely only on chemical measurements.
Differences in land use, stream habitat, and stream chemistry between the groups of sites suggest possible causes for the different invertebrate communities. The less impaired group of sites drained basins that were unmined, or where less than 10,000 ton/miwere mined during 1980–95. Most basins in the more impaired group of sites had been mined within the last 20 years by both surface and underground methods; most contained abandoned mines that pre-dated SMCRA and produced 100,000 to 1,000,000 ton/miof coal. Some of the basins in the more impaired group, however, had not been mined since 1980. Coal production during 1980–95 is not an ideal indicator of the environmental disturbance caused by coal mining, but it related better to environmental measurements than did production over a shorter interval, number of abandoned mines, or mine discharge permits (Chambers and Messinger, 2001).
At the more impaired sites, the proportion of total land area as strip mines, quarries, disturbed land, or gravel pits was significantly greater than at the less impaired sites. In addition, sulfate concentration, specific conductance, and alkalinity of stream water were all higher. Stream pH did not differ significantly between the two groups; pH is regulated in mine discharges.
Two basins that were not mined since 1980 contained valley fills similar to those constructed at large surface mines. The invertebrate community in Mill

Figure 10. Invertebrate-community metrics show generally better conditions (lower MHBI) at sites with coarser streambeds and lower sulfate concentrations, although correlations are weak.
8 Water Quality of the Kanawha–New River Basin Creek near Hopewell, W. Va., which drains an area with few relatively small fills, grouped with the less impaired sites. Davis Creek at Trace Creek, W. Va., drains several large fills at a shopping center and was in the poorer group.
Instream habitat structure also differed significantly between the two groups. Sites from the less impaired group had less sand and silt in the stream bottom. Smaller median sediment size correlated with decreased number of taxa of mayflies, stoneflies, and caddisflies (EPT taxa) and an increased (more impaired) score on the Modified Hilsenhoff Biotic Index (fig. 10; r= 0.46 and 0.43, respectively). Among the sites sampled, correlations between invertebrate metrics and coal production (or factors relating to coal mining) were weak, largely because some streams were impaired by other land uses. Erosion and sediment deposition in basins with active mines have decreased overall because of controls required under SMCRA, but temporal comparisons are not possible. Sedimentation in 1998 remained generally greater, however, at sites in basins with coal production since 1980 than in unmined basins.
The invertebrate-community degradation represented the cumulative effects of mining before and after SMCRA, deep mining and surface mining, mines in and out of compliance with applicable regulations, and all other nonmining disturbances in the basins. Impaired sites from this region ranked near the middle of an index that ranked NAWQA sites representing different land uses throughout the United States. (See discussion of effects on invertebrate communities nationally, p. 11). Logging and ongoing construction probably contribute to sedimentation, but their extent in each basin could not be quantified. Logging may contribute more sediment per disturbed volume of soil than mining.
Regional study: Sulfate concentrations and biological communities in Appalachian coal fields indicated mining-related disturbances despite a general water-quality improvement between 1980 and 1998
In a 1998 study to assess regional water-quality effects of coal mining (Eychaner, 1999), samples representing the Northern Appalachian coal field were collected in the Allegheny and Monongahela River Basins (ALMN), where high-sulfur coal is common and acid mine drainage was historically severe, and samples for the Central Appalachian coal field were collected in the Kanawha–New River Basin (KANA), where acid drainage is uncommon (fig. 11).
Water chemistry in 178 wadeable streams was analyzed once during low flow, in July and August 1998. Drainage area for most streams was between 4 and 80 mi. Most (170) of these sites were also part of a study on the effects of coal mining that was conducted during 1979–81 (Herb and others, 1981a, 1981b; 1983; Ehlke and others, 1982), before regional water quality was affected by implementation of regulations from the Surface Mining Control and Reclamation Act (SMCRA). At 61 sites, aquatic invertebrates (insects, worms, crustaceans, and mollusks) also were collected. Ground water was sampled from 58 wells near coal surface mines and 25 wells in unmined areas. Wells sampled downgradient from reclaimed surface coal mines reflect the local effects of mining.

Figure 11. Coal seams in the Appalachian coal region vary in sulfur content, and the fields are identified primarily on the basis of this difference (Tully, 1996). The Kanawha–New River Basin contains mostly lower sulfur coal, while the Allegheny and Monongahela River Basins contain mostly higher sulfur coal.
Concentrations of Regulated Constituents Improved in Stream Base Flow From About 1980 to 1998
During low-flow conditions, sulfate in more than 70 percent of samples from streams downstream from coal mines in both coal regions exceeded the regional background concentration. Background was calculated as about 21 mg/L sulfate from data for basins with no decreased among mined basins between 1979–81 and 1998 in both regions, reflecting that regulations restricting these constituents in mine drainage are effective. Even so, stream sites downstream from mines more commonly exceeded drinking-water guidelines for sulfate, iron, manganese, and aluminum concentrations than streams in unmined basins (fig. 12). history of coal mining. The highest concentrations were measured in basins with the greatest coal production. Onefourth of all samples exceeded 250 mg/L, the USEPA drinking-water guideline.

Figure 12. drinking-water guidelines at mined sites than at unmined sites.
Total iron, total manganese, and total aluminum also exceeded regional background concentrations (129, 81, and 23 μg/L, respectively) in many streams in mined basins. The median concentrations of total iron in the northern coal region were about equal between mined and unmined basins, but in the central region, concentrations of median total iron among mined basins were lower than among unmined basins. In both regions, median concentrations of total manganese among mined basins were about double that among unmined basins.
Median pH increased, and median concentrations of total iron and total manganese

Aquatic Benthic Invertebrate Communities are Impaired in Mined Basins
Aquatic invertebrate communities tended to be more impaired where there was more coal mining, when compared to basins where there was little coal mining. Pollution-tolerant species are more likely to be present at mined sites than at unmined sites, whereas pollutionsensitive taxa were fewer in number or non existent in heavily mined basins. Increasing coal production correlated with both an increased concentration of sulfate and a decline in some aquatic insect populations (fig. 13). Of the 61 sites where aquatic invertebrates were collected, those sites with sulfate concentrations higher than the estimated background concentration had the lower diversity of three groups of sensitive insect species (mayflies, stoneflies, and caddisflies), even though the pH of the water at all sites was greater than 6.5.
At the concentrations measured, the sulfate ion is relatively non toxic to aquatic organisms and may not represent the cause of the decline observed in mayflies and stoneflies. Sulfate concentration was, however, positively correlated with the total coal production from a basin (Sams and Beer, 2000). Other landscape disturbances associated with coal mining—changes in streamflow, siltation, or trace metal contamination—could affect the invertebrate community. Negative effects on communities caused by mining were of similar magnitude to the effects

Figure 15. exceeded drinking-water guidelines in mined areas than in unmined areas.
10 Water Quality of the Kanawha–New River Basin of urban development, agriculture, large construction projects, flow alterations, or wastewater effluent.

Figure 14. Sulfate concentrations in ground water are greater within 1,000 feet of reclaimed surface coal mines and in the northern coal region than at greater distance and in the central coal region.
Sulfate, Iron, and Manganese Concentrations were Elevated in Wells Near Reclaimed Surface Mines
At mined sites in both coal regions, pH was lower and sulfate concentration was greater at mined sites than at unmined sites. Sulfate concentrations in ground water were higher than background concentrations in shallow wells within 1,000 feet of reclaimed surface mines (fig. 14). Samples from wells in the northern coal region contained more sulfate than wells at unmined sites in the same region, or at any of the sites in the central coal region. Iron, manganese, and aluminum were higher than background concentrations within about 2,000 feet of reclaimed surface mines (1,800, 640, and 11 μg/L, respectively).
Water from most wells, except at unmined sites in the northern coal region, exceeded guidelines for iron and manganese, which make the water unpleasant to drink (fig. 15). The concentrations in both regions were higher near reclaimed mines than at unmined sites.
Invertebrate communities at two coal mining stream sites ranked near the middle of more than 600 NAWQA sites sampled nationwide during 1991–98. These sites had index scores better than national median scores for urban sites, about the same as national median scores for agricultural sites, and worse than national median scores for undeveloped sites. The community at a forested and undeveloped site in the Appalachian Plateaus was within the best 10 percent of NAWQA sites nationally and within the best 25 percent of undeveloped sites.
Nationally, invertebrate communities at heavily agricultural sites were commonly highly impaired. In the Kanawha–New River Basin, agriculture is usually of low intensity and centers on pasturing small herds of cattle and growing cattle feed. Invertebrate communities at two agricultural sites, one in the Appalachian Plateaus and one in the Blue Ridge Physiographic Province, were within the best 10 percent of all sites nationally.
Some Contaminants are Widespread and Present at Potentially Harmful Concentrations in Streambed Sediment and Fish Tissue
Forty samples of streambed sediment from 36 sites in the Kanawha–New River Basin were analyzed for polycyclic aromatic hydrocarbons (PAHs) during 1996–98. PAHs are components of wood smoke, diesel exhaust, soot, petroleum, and coal. Their toxicity varies, and some are carcinogenic to humans and other animals. Of the 12 PAHs for which guidelines were available, 10 were detected at concentrations exceeding the Probable Effect Level (PEL; see information box on sediment-quality guidelines), and all were detected at concentrations exceeding the Threshold Effect Level (TEL).
High concentrations of PAHs were present in each physiographic setting in the basin except for the Blue Ridge, although the only high concentrations in the Valley and Ridge/Appalachian Plateaus transition zone were in basins where coal has been mined. The highest
Effects of mining on invertebrate communities were of similar magnitude to the effects caused by urban development and agriculture nationally

NAWQA’s bed-sediment sampling protocol (Shelton and Capel, 1994) is designed to maximize the chance of detecting contaminants that have been transported in a stream during the previous 1–3 years. The data from this study were compared to final Canadian Sediment Quality Guidelines (SQGs) rather than the preliminary USEPA guidelines. SQGs have been issued by Environment Canada for 8 trace elements and 12 PAHs (Canadian Council of Ministers of the Environment, 1999). At concentrations below a Threshold Effect Level (TEL), contaminants are rarely expected to have a toxic effect on aquatic life. At concentrations above a Probable Effect Level (PEL), toxic effects are expected frequently. Concentrations of substances that exceed SQGs may imply, but not prove, that organisms in the streams of interest are at risk from those substances.
PAH concentrations measured in this study were in the Appalachian Plateaus. Some of the highest PAH concentrations were measured at some of the most heavily mined sites in the basin, although the correlation between coal production and streambed PAH con-
Major Findings 11 centration was weak (r= 0.52, among 20 wadeable stream sites within the coal region). Coal samples from several commonly mined seams in West Virginia were between 20 and 85 percent PAH by mass (W.H. Orem, U.S. Geological Survey, written commun., July 2000). Coal particles are common in sediment from many streams in the coal fields. The PAHs from the coal particles, however, may not be bioavailable (Chapman and others, 1996). Unlike other NAWQA study areas, no correlation was found between most other land uses and PAH concentration.

Figure 16. exceeded Environment Canada's effects-based criteria at several sites in the basin. Probable effects levels (PEL) are those concentrations at which harmful effects to aquatic life are thought to be likely, and were exceeded most frequently in the Allegheny Highlands and other Appalachian Plateaus streams. Threshold effects levels (TEL) were exceeded at all sites by nickel and chromium. *Valley and Ridge sites include transition zones between provinces.
A total of 53 bed-sediment samples from 47 sites in the Kanawha–New River Basin were analyzed for trace elements during 1996–98. All eight of the trace elements for which criteria were available were found at some sites in concentrations exceeding their Threshold Effect Level (fig. 16; see information box on sediment-quality guidelines). Nickel, chromium, zinc, and lead were detected at concentrations exceeding their Probable Effect Level. Nickel concentrations exceeded the Probable Effect Level most frequently (in 47 of the 53 samples), based on the 1995 Sediment Quality Guidelines; a final SQG was not issued for nickel at the time that other SQGs were finalized.
Trace-element concentrations also were determined in livers of common carp or rock bass in 27 samples from 18 sites in 1996 and 1997. Some samples contained concentrations of arsenic, cadmium, lead, mercury, nickel, selenium, and zinc that were among the highest 25 percent of more than 900 NAWQA samples nationwide (1991–98). Concentrations of cadmium, mercury, nickel, selenium, and zinc in fish-tissue samples from the Kanawha–New River Basin ranked among the highest 10 percent of all NAWQA samples; six samples contained cadmium concentrations ranking among the highest 10 percent of all NAWQA samples, and five samples contained selenium concentrations ranking among the highest 10 percent of all NAWQA samples. One fish-tissue sample, from Kanawha River at Winfield, contained cadmium at a concentration ranking in the highest 1 percent of all samples in the
12 Water Quality of the Kanawha–New River Basin Nation. Determining the human health or ecological significance of these concentrations is problematic, because tissue samples were collected from many different species and because fish-liver tissue is not normally eaten by humans.
Fish Communities Differ Considerably Throughout the Basin, but Non-native Species Continue to Expand Their Range
Fish communities in the Kanawha–New River Basin are complex and vary widely among streams of different size, physiographic setting, and land use. Individual species are distributed in patches, particularly upstream from Kanawha Falls (Jenkins and Burkhead, 1994). This patchy distribution can confound comparisons among streams (Strange, 1999). The quality of the regional fish community is generally good, although the national NAWQA fish index seems to underrate that quality because it does not consider the patchy distribution.
Three fish species were collected for the first time at often-sampled sites in tributaries of the New and Gauley Rivers (Cincotta and others, 1999). Margined madtoms, a popular bait species, were collected for the first time from Second Creek near the village of Second Creek. Margined madtoms are native to some parts of the New River and some of its tributaries, but they had never before been collected from the Greenbrier River Subbasin. Telescope shiners (fig. 17), natives of the Tennessee River Basin, have been collected in the New River since 1958, and they continue to expand their range. Telescope shiners were collected from another often-sampled site, Williams River at Dyer, in the Gauley River Subbasin; this was their first collection upstream from Summersville Dam, a large impoundment. Telescope shiners also were collected for the first time from two Meadow River tributaries, also in the Gauley River Subbasin. Least brook lamprey were collected for the first time from Williams River at Dyer, their second collection from the Gauley River Subbasin. Populations of all these species were well established, and the ongoing expansion of their ranges suggests that all were relatively recent bait-bucket introductions to the New River system. Two of these reaches, and all of these streams, had been thoroughly sampled in the late 1970s (Hocutt and others, 1978, 1979).
Other fish collected for the first time in the basin were in tributaries of the Coal River. The new species in Coal River distribution records were from large tributaries where few or no surveys had been made since the 1930s. Mottled sculpin, bluebreast darter, river carpsucker, blacknose dace, and longnose dace all were collected for the first time from Clear Fork near Whitesville or Spruce Laurel Fork at Clothier, major tributaries to the Big or Little Coal Rivers, respectively. Several of these records represented the most upstream collections in their respective forks of the Coal River, although all had been collected from the Coal River Subbasin. These new-species records most likely represent undersampling of streams that have often been overlooked by investigators rather than new range expansions.
In some regions of the United States, the highest proportion of non-native fish are typically present in the most impaired streams (Maret, 1997; Waite and Carpenter, 2000). In these regions, unimpaired streams are typically cold-water streams with complex physical habitat and low nutrient concentrations. In impaired streams where agricultural and urban land uses are common, stream temperature and nutrient concentrations are high and physical habitat is degraded. Many non-native fish tolerate these conditions better than many native species do, enabling the non-natives to displace the natives. No such relation was found in the Kanawha–New River Basin, where sedimentation and increased dissolved solids have impaired streams, but where temperature and nutrient concentrations have remained low (Messinger and Chambers, 2001, in press). The proportion of introduced fish in the New River system was high, even though other measures did not indicate impairment.
The New River system, which fisheries biologists consider to include the Gauley River and its tributaries, supports a different collection of fish species than the downstream Kanawha River system, which is part of the larger Ohio River system (Jenkins and Burkhead, 1994). Kanawha Falls (see front cover), a 24-foot waterfall 2 miles downstream from the confluence of the New and Gauley Rivers, is the boundary between the New River and Kanawha River systems. This waterfall has been a barrier to upstream fish movement since glaciers affected streams more than 1 million years ago. The New River system lacks native species diversity, and it has unfilled ecological niches. It has only 46 native fishes and the lowest ratio of native fishes to drainage area of any river system in the Eastern United States.
The lack of native-species diversity allowed other species to develop in the New River system, which has the largest proportion of endemic species (found nowhere else in the world) in eastern North America (8 of 46). Introduced fish species have prospered in the New River system; Jenkins and Burkhead (1994) cite the New River system as having the largest number and proportion (42 of 89) of introduced freshwater species
Major Findings 13 of all major eastern and central North American drainages.
Although many species have been introduced and become naturalized throughout the 19th and 20th centuries, the New River fish fauna remain susceptible to invasion. In contrast, 118 fish species are reported from the Kanawha River system downstream from Kanawha Falls (Stauffer and others, 1995); none of these fish species are endemic to the Kanawha River system, and only 15 are considered possible, probable, or known introductions.
In testing the possible effects of coal mining on fish communities, results were less definitive than for benthic invertebrates (p. 8–9). No common fish metrics (Karr and Chu, 1999; Barbour and others, 1999) correlated closely with mining intensity or its surrogate, sulfate concentration. The study included sites both upstream and downstream from Kanawha Falls, and differences in many metrics between the two groups mask differences among land-use categories (Messinger and Chambers, 2001, in press). However, fish were collected at only 13 wadeable sites in the coal region, which did not represent a full gradient of mining intensity.
High Concentrations of Fecal Bacteria Remain in Streams if Sources are Close
Concentrations of Escherichia coli (E. coli) exceeded the national guideline for public swimming areas in 26 percent of samples from major rivers in the Kanawha–New River Basin and in 43 percent of samples from tributary streams (fig. 18); however, no outbreak of waterborne disease was reported from the basin during 1991–98 (Barwick and others, 2000). Bacteria concentration
14 Water Quality of the Kanawha–New River Basin in stream water varies widely, reflecting the changing balance between bacterial sources and many factors that help or hinder bacteria transport. Because of the wide variability, comparisons between streams based on only a few samples can be misleading; a few generalizations, however, can be made.
First, streams contain more bacteria if the sources are close to the stream and the sampling site. Among large rivers, median concentrations of E. coli were lowest in the New River Gorge at Thurmond, in a reach distant from any large city (fig. 18). Concentrations were highest in the Kanawha River downstream from the Charleston metropolitan area at Winfield. In the two tributary basins with the highest median concentrations, most homes are clustered close to the streams because the land slopes steeply elsewhere. In contrast, four tributary streams in basins with more moderate slopes, where bacteria sources are more dispersed, had median E. coli concentrations less than half as high. Regardless of slope, direct contamination of a stream by sewage or manure can produce extremely high concentrations, as Gillies and others (1998) observed in the Greenbrier River.
Second, bacteria concentrations exceeding guidelines are much more common when streamflow is greater than average, so streams generally contain more bacteria in winter than in summer (fig. 19). E. coli concentrations exceeded guidelines in less than one-third of summer samples from moderate-slope tributaries and less than one-fifth from large rivers. In the three tributary basins with steeper slope, however, concentrations were higher in summer than winter.

Figure 19. more often in winter than in summer for most streams.
Finally, streams contain more bacteria if the bacteria sources are large. Williams River, the tributary basin with the lowest median concentration of E. coli (fig.
18) is home to only 5 people per square mile, compared
to the average of 71 people per square mile throughout the entire Kanawha–New River Basin. For twice the population density, median E. coli was about 300 percent higher among steep-slope tributaries. Among the moderate-slope basins, however, including the Bluestone River Basin with 201 people per square mile, median E. coli was only about 10 percent higher for twice the population density. Neither the estimated number of cattle nor the percentage of agricultural land use in the tributary basins showed a relation to the median bacteria concentrations.
Escherichia coli (E. coli) is a bacterium that grows in the intestines of people, other mammals, and birds. Most strains of E. coli do not cause disease, but they do indicate water contamination by feces, which could contain other disease-causing organisms. The national guideline for public swimming areas is less than 235 E. coli colonies per 100 milliliters of water (col/100 mL) in any single sample (U.S. Environmental Protection Agency, 1986). That level is intended to allow no more than 8 gastrointestinal illnesses per 1,000 swimmers. For waters infrequently used for full-body-contact recreation, the guideline is 576 col/100 mL.
Nutrient and Organic-Chemical Concentrations in Surface Water are Low in Most of the Basin
Mean concentrations of nutrients in the Kanawha– New River Basin were at or below national background levels. Most concentrations, however, exceed those measured at a stream-water-monitoring site at Williams River, which drains mostly National forest. The highest mean nitrate concentration measured was 1.5 mg/L. Flow-weighted mean ammonia concentrations ranged from less than 0.02 to 0.04 mg/L. Mean total phosphorus concentration was less than 0.1 mg/L at nine sites; the maximum was 0.15 mg/L. Nitrate and phosphorus are typically increased by agricultural or urban land uses, and certain nutrients, such as ammonia, can accumulate from natural sources.
Differences in nutrient concentrations were found among sites because of differences in land use/land cover, and physiography. Generally, basins with more agriculture produced more mean total nitrogen than did forested basins. The lowest mean total nitrogen concentration in streams, 0.71 mg/L was that for mostly forested tributary basins in the Appalachian Plateaus produced (fig. 20). The lowest mean concentration in the basin, or background concentration, was 0.45 mg/L, at Williams River. Tributary streams with basins mostly or wholly within the Valley and Ridge Physiographic Province had the highest mean total nitrogen, 1.04 mg/L. One stream in the Blue Ridge had a mean total nitrogen concentration of 0.94 mg/L. The mean total nitrogen concentration was not substantially different between large rivers and smaller tributaries (0.83 and 0.90 mg/L respectively).
Four sites, draining forest mixed with agriculture or coal mining, ranked among the best sites in the Nation in a national Algal Status Index. This index measures the proportion of algal samples that belong to species that are tolerant of high nutrient concentrations and siltation.
Pesticides were sampled for 9 to 25 times at four sites in 1997. Two sites were on main-stem, large streams. The other two sites on tributary streams drained basins with more than 30 percent agricultural
Major Findings 15 land and some urban land. (See Study Unit Design, p. 20). Time of sampling covered the seasonal spectrum of both climate and pesticide application. The pesticides detected at all sites are routinely detected at agricultural sites across the Nation.
Surface-water samples in the Kanawha–New River Basin contained only a few pesticides at low levels. In all, 23 of 83 pesticides analyzed for were detected (Ward and others, 1998). All pesticide detections were less than 1 μg/L; concentrations detected did not exceed USEPA drinking-water standards or aquatic-life criteria. The most commonly detected pesticides were atrazine, deethylatrazine (a breakdown product of atrazine), metolachlor, prometon, simazine, and tebuthiuron. Atrazine, deethylatrazine, metolachlor and simazine were detected in more than 90 percent of samples.
Dioxin is a particularly toxic contaminant in certain herbicides formerly manufactured near Charleston and is a known contaminant in the lower Kanawha River, but it was not analyzed for this study. Dioxin in the lower Kanawha River is the target of ongoing regulatory investigations by USEPA and other agencies.
Numerous volatile organic compounds (VOCs) have been detected routinely at low concentrations in the Kanawha River downstream from the Charleston metropolitan area (Tennant and others, 1992). In this study, more than 20 VOCs were detected, at concentrations ranging from 0.015 to 0.3 μg/L, in each of two samples collected in late 1997 from the Kanawha River at Winfield. Each sample was analyzed for 85 compounds (Ward and others, 1998). The compounds detected at
16 Water Quality of the Kanawha–New River Basin Winfield, downstream from Charleston, included chloroform, motor fuel and aromatic compounds such as benzene, and industrial compounds such as ethers. In contrast, only a single compound was detected in one of two samples collected from the Kanawha River upstream at Kanawha Falls.
During 1987–96, one or more of 21 VOCs were detected in 50 percent of all daily samples collected for the Ohio River Valley Water Sanitation Commission (ORSANCO) from an industrial water intake at St. Albans, downstream from Charleston (Lundgren and Lopes, 1999). Benzene and toluene were the two most frequently detected compounds, and a maximum of 11 compounds was detected in a single sample. Median concentrations ranged from 0.1 to 2.3 μg/L. Gasoline spills or leaks of as little as 10 gallons per day that reach the river could produce the concentrations measured at St. Albans.
Radon Concentrations and Bacterial Contamination are the Principal Ground-Water-Quality Concerns
Ground water from private wells provides domestic supply for 30 percent of the people in the Kanawha– New River Basin. High concentrations of radon are a concern in the Blue Ridge (p. 18), and private wells can be contaminated by fecal bacteria throughout the basin (p. 19), but the occurrence of other contaminants differs among the physiographic provinces. In the layered sedimentary rocks of the Appalachian Plateaus, ground water moves mostly in a network of narrow fractures within a few hundred feet of the land surface (Wyrick and Borchers, 1981; Harlow and LeCain, 1993). Individual fractures typically connect to only a few others, and a well normally taps only a few of the many fractures nearby. Recharge comes from rain and melting snow. Ground water flows generally toward the nearest stream, forming local aquifers bounded by the ridgetops. Contamination of a local aquifer and its stream is most likely to come from local sources.
Water samples were collected from 30 newer domestic wells or similar-capacity public-supply wells throughout the Appalachian Plateaus (Sheets and Kozar, 2000) and from 28 generally older domestic wells close to surface coal mines where reclamation was completed between 1986 and 1996. Wells near active mines were not sampled. Most of the wells were between 40 and 200 feet deep, and most water levels were between 10 and 90 feet below land surface.
Concentrations of iron and manganese exceeded USEPA drinking-water guidelines in 40 and 57 percent, respectively, of the wells throughout the Appalachian Plateaus and in about 70 percent of wells near reclaimed mines. Water that exceeds these guidelines is unpleasant to drink and can stain laundry and plumbing fixtures, but it is not a health hazard.
Potentially hazardous concentrations of methane, an odorless component of natural gas that is often associated with coal seams, were detected in water at 7 percent of the wells. At concentrations greater than about 10 mg/L, methane can bubble out of water pumped from a well. If enough gas collects in a confined space, an explosion is possible. In the West Virginia coal fields, any well water that bubbles is a potential methane explosion hazard.
Other chemical analyses of ground water samples collected as part of this study showed the following water-quality characteristics and conditions. Water from 61 percent of the wells near reclaimed mines was slightly acidic (pH less than 6.5) and could leach lead or copper from water pipes in homes. Only 23 percent of other Appalachian Plateaus wells produced acidic water. Radon exceeded the proposed USEPA standard at half the wells throughout the Appalachian Plateaus (p. 18). Water from half the wells exceeded 20 mg/L of sodium, the upper limit that USEPA suggests for people on a sodium-restricted diet. Arsenic in water from 7 percent of the wells exceeded the 10-μg/L standard set in January 2001, but none exceeded the previous 50-μg/L standard. Concentrations of radon, sodium, and arsenic were lower in wells near reclaimed mines than in wells remote from reclaimed mines. Home water-treatment techniques can remove lead, copper, sodium, and arsenic from drinking water.
In the igneous and metamorphic bedrock of the Blue Ridge, as in the Appalachian Plateaus, ground water moves in a network of shallow fractures. Local aquifers generally drain toward the nearest stream (Coble and others, 1985).
Water samples were collected from 30 newer domestic wells or similar low-capacity public-supply wells throughout the Blue Ridge. Most of the wells were between 100 and 350 feet deep, and most water levels were between 10 and 70 feet below land surface.
Ground water in the Blue Ridge is susceptible to contamination. Chlorofluorocarbon concentrations showed that the water in 89 percent of the wells had been recharged within the previous 20 years, indicating that contaminants could be transmitted readily into the fractured rock aquifers (Kozar and others, 2001).
Chemical analyses of ground water samples collected as part of this study indicated that concentrations of radon were among the highest in the Nation (p. 18); iron and manganese concentrations exceeded guidelines at only 17 percent of the wells; sodium exceeded 20 mg/L at 3 percent of the wells; and arsenic did not exceed 1 μg/L at any of the sites. Pesticides were detected at 57 percent of the wells. The presence of the common agricultural herbicide atrazine in ground water, even in low concentrations, shows that potential contaminants could move quickly from the land surface into the drinking-water aquifer.
Valley and Ridge Physiographic Province ground-water conditions can be inferred from studies in similar settings in the Potomac River Basin, which was one of the 1991 NAWQA study units. See Lindsey and Ator, 1996 and Ator and others, 1998 for more details.
Radon concentrations in ground water were among the highest in the Nation

remove radon from both drinking water and interior air. The only way to determine if an individual well or home exceeds standards, however, is to have the water or air tested. Information on radon testing and removal is available at http://www.epa.gov/safewater/radon/qa1.html and other Web sites.
Radon concentration exceeds 1,000 pCi/L (picocuries per liter) in at least 25 percent of ground-water samples collected in many areas of the Eastern United States. In the Kanawha–New River Basin, 30 percent of samples exceeded 1,000 pCi/L (Appendix, p. 27), making the basin comparable to the Potomac and Lower Susquehanna River Basins to the northeast. Within the basin, however, radon in two-thirds of samples from wells in the Blue Ridge exceeded 1,000 pCi/L, but only in 10 percent of samples from the Appalachian Plateaus. The northern part of the basin, therefore, is more comparable to the adjacent Allegheny and Monongahela Rivers and Upper Tennessee River Basins.
Radon concentrations were greater than 300 pCi/L, the proposed drinking-water standard (U.S. Environmental Protection Agency, 1999), in 87 percent of wells sampled in the Blue Ridge (fig. 21). The maximum concentration detected was 30,900 pCi/L (Kozar and Sheets, 1997). Of the 30 wells sampled, 10 contained concentrations of radon greater than 4,000 pCi/L, the alternate standard USEPA has proposed for regions where action is taken to decrease airborne radon. As water is used in a home, radon in the water can lead to an increase in radon in the air, which is the major exposure path for people.
Radon concentrations exceeded 300 pCi/L at 50 percent of wells sampled throughout the Appalachian Plateaus. The maximum in any sample was 2,500 pCi/L (fig. 21). The area is underlain primarily by sandstone, shale, coal, and limestone sedimentary rocks, in which uranium is less common than in igneous and metamorphic rocks.
18 Water Quality of the Kanawha–New River Basin At 28 wells downgradient from recently reclaimed surface coal mines, the median radon concentration was just 115 pCi/L, and the maximum was 450 pCi/L.

Figure 21. Radon concentrations vary greatly among physiographic provinces.
Radon is a radioactive gas that forms during the decay of natural uranium. Igneous and metamorphic rocks, like those in the Blue Ridge, commonly contain more uranium than other rock types. Radon in the air in homes is the second leading cause of lung cancer; and radon causes 2–3 percent of all cancer deaths in the United States. Homes can be designed or remodeled to In comparison, at 15 wells in the same geologic units but not near mines, the median concentration was 200 pCi/L.
Escherichia coli (E. coli) and the broader fecal coliform group of bacteria indicate the possible presence of disease-causing organisms. Standards for public drinking-water supplies do not permit the presence of any of these bacteria at detectable levels. Septic systems or livestock near a well are the probable sources of bacteria throughout the basin. Proper well construction can prevent bacteria from reaching the well water in some settings, and drinking water can be disinfected with chemicals or ultraviolet light.
Water from wells less than 25 years old in the Appalachian Plateaus and Blue Ridge was generally free from fecal bacteria (table 2). The sampled wells were generally in good condition, with a section of solid pipe at the top of the well sealed with concrete into the soil and rock (Sheets and Kozar, 1997). A residential septic system typically was nearby, but no heavy livestock use was within several hundred yards. Bacteria were found, however, at one fourth of the wells in a second study in the Appalachian Plateaus, which included some older wells and some without seals. Near these wells, there also may have been bacteria sources other than a septic system.
Most wells in limestone aquifers in the basin, including the Valley and Ridge, are at risk of contamination by bacteria (Boyer and Pasquarell, 1999), even if septic systems or livestock wastes are not nearby (Mathes, 2000), because ground water moves rapidly through solution channels in the rock. The wide valleys that typically overlie limestone aquifers are heavily used for livestock and agriculture.
Both volatile organic compounds (VOCs) and pesticides were detected at low concentrations in the ground water of the Kanawha–New River Basin (Appendix, p. 27). Thirteen percent of samples (9 of 60) contained VOC concentrations greater than 0.1 μg/L. Of the seven detected VOCs, however, only three have established drinking-water standards. None of the VOCs identified in samples exceeded these standards. Pesticides were found above a detection limit of 0.001 μg/L in 32 percent of samples (19 of 60). Of the 12 detected pesticides, 4 have established drinking-water standards, none of which was exceeded.
Pesticides were detected in 17 of 30 wells sampled in the Blue Ridge, where 30 percent of the land was being used for agriculture in 1993. The most commonly detected pesticides, at one-third of the wells, were atrazine and its breakdown product deethylatrazine. The maximum concentration of all pesticides detected in a single sample was 0.14 μg/L. Two other pesticides, p,p′-DDE and simazine, were present in more than 10 percent of samples at a maximum concentration of 0.025 μg/L in this province. In the largely non agricultural Appalachian Plateaus, however, pesticides were detected only at two wells.
Nutrients were prevalent at relatively low concentrations in ground water of the Kanawha–New River Basin. Nitrate concentration in 1 of 88 wells sampled in this study exceeded the USEPA drinking-water standard of 10 mg/L (as nitrogen). Most ground water contained less nitrate than does precipitation in the basin. Concentrations of other nutrients measured were at or below national background levels. These findings are consistent with national findings on nutrients in the ground water of forested areas, and the Kanawha-New River Basin is about 80 percent forested.
In the water of Appalachian Plateaus wells, the relatively high median ammonia concentration for a forested region–0.16 mg/L– is probably a result of mineralization of organic material. In contrast, ground water in the Blue Ridge, where a greater percentage of land is used for agriculture, had ground water with a higher median nitrate concentration (0.42 mg/L) and a higher median dissolved-oxygen concentration (5.1 mg/L).
STUDY UNIT DESIGN
Studies in the Kanawha–New River Basin were designed to describe the general quality of water and the aquatic ecosystem and to relate these conditions to natural and human influences (Gilliom and others, 1995). The design focused on the principal environmental settings—combinations of geohydrology, physiography, and land use—throughout the basin. The studies supplement assessment work by State agencies (Virginia Department of Environmental Quality, 1998; North Carolina Department of Environment and Natural Resources, 1999; West Virginia Division of Environmental Protection, 2000).
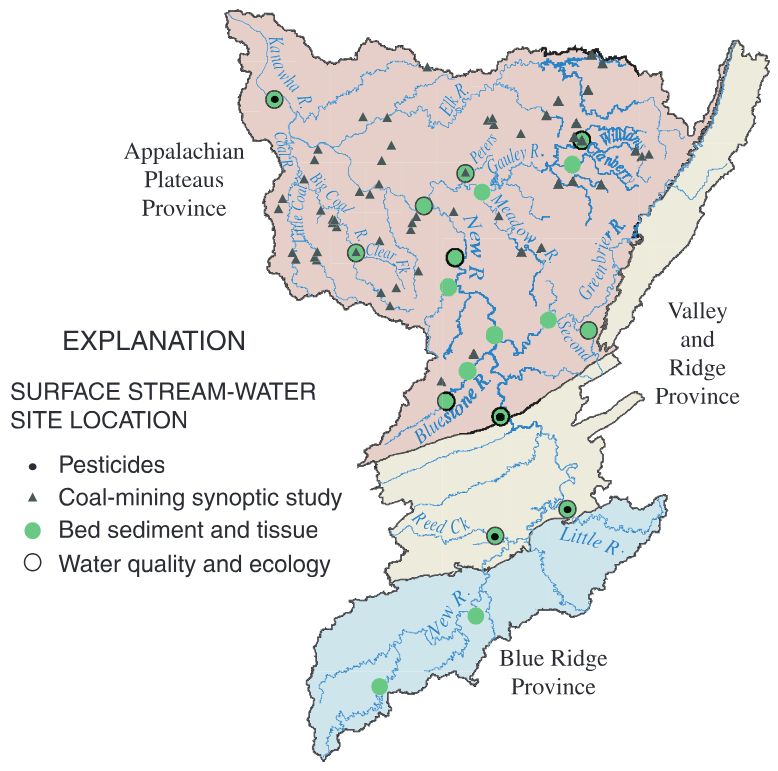
Stream Chemistry and Ecology
The sampling network was designed to characterize the effects of land use on stream quality at various scales. Water chemistry, fish and invertebrate communities, habitat, and bed-sediment and fish-tissue chemistry were used as indicators of stream quality. Fixed Sites were chosen on large rivers at the boundary between the Valley and Ridge and Appalachian Plateaus Physiographic Provinces, downstream from the Greenbrier and Gauley Rivers, and near the mouth of the Kanawha River. Fixed Sites also were chosen on tributaries to represent the effects of agriculture, coal mining, forest, and a relatively large human population in an otherwise rural setting.

Water Quality in the Kanawha–New River Basin
Ground-Water Quality
The ground-water network was designed to broadly characterize the resource. Little previous information was available in the aquifer-survey areas. Aquifer surveys examined more constituents than any previous study and included a random component in site selection that allows estimates to be made for the whole population of similar wells. The land-use study targeted current effects of mining reclamation standards that have developed since around 1980. Study Unit Design

Aquifer Surveys— General water quality, to determine the occurrence and Blue Ridge and distribution of contaminants. Data included major ions, Appalachian Pla- nutrients, bacteria, organic carbon, 19 trace elements, Domestic and public supply wells 25 years old 60 Once in 1997. teaus 47 pesticides, 86 volatile organic compounds, dissolved and younger, and in good condition. oxygen, turbidity, pH, specific conductance, and tem- perature. Samples from the Blue Ridge were analyzed for an additional 39 pesticides.
GLOSSARY
Water Quality in the Kanawha–New River Basin Glossary
REFERENCES
Water Quality in the Kanawha–New River Basin References Water Quality in the Kanawha–New River Basin

Greenbrier River near Seebert, WV. Photograph by Katherine S. Paybins, USGS.
APPENDIX—WATER-QUALITY DATA FROM THE KANAWHA–NEW RIVER BASIN IN A NATIONAL CONTEXT

Water-Quality Data in a National Context Water Quality in the Kanawha–New River Basin Water-Quality Data in a National Context Water Quality in the Kanawha–New River Basin Water-Quality Data in a National Context Water Quality in the Kanawha–New River Basin
A COORDINATED EFFORT National Water-Quality Assessment (NAWQA) Program Kanawha–New River Basin


U.S. Geological Survey Circular 1204
Where this page came from
This page was imported from U.S. Geological Survey. Published by the U.S. Geological Survey and, as a work of the United States government, in the public domain.
Nobody has written it yet — it is the source material at a new address, which is why search engines are asked to skip it and why no one earns from it. It is up for grabs: take it on, and it is yours to rewrite and to earn from.
Licence: CC0 1.0 (public domain) · Adapted from pubs.usgs.gov
1
0
0
0

Comments


