Viu algo para melhorar? Proponha uma alteração.

Over the course of several days, unusually heavy monsoonal rains have fallen over China and neighboring countries, including India and Japan. During the week of July 7, 2020, the NOAA/NASA Suomi-NPP satellite (SNPP) and the NOAA-20 satellite teamed up to give researchers and first responders a clearer picture of what’s on the ground in Asia to help rescue and relief efforts. From July 14 to 15, over 4 inches of rain fell around the Yangtze River Basin in Jiangxi province in China, one of the worst affected places. The historic floods in Asia, which started in late June, have resulted in 141 people dead or missing, and 38 million displaced.
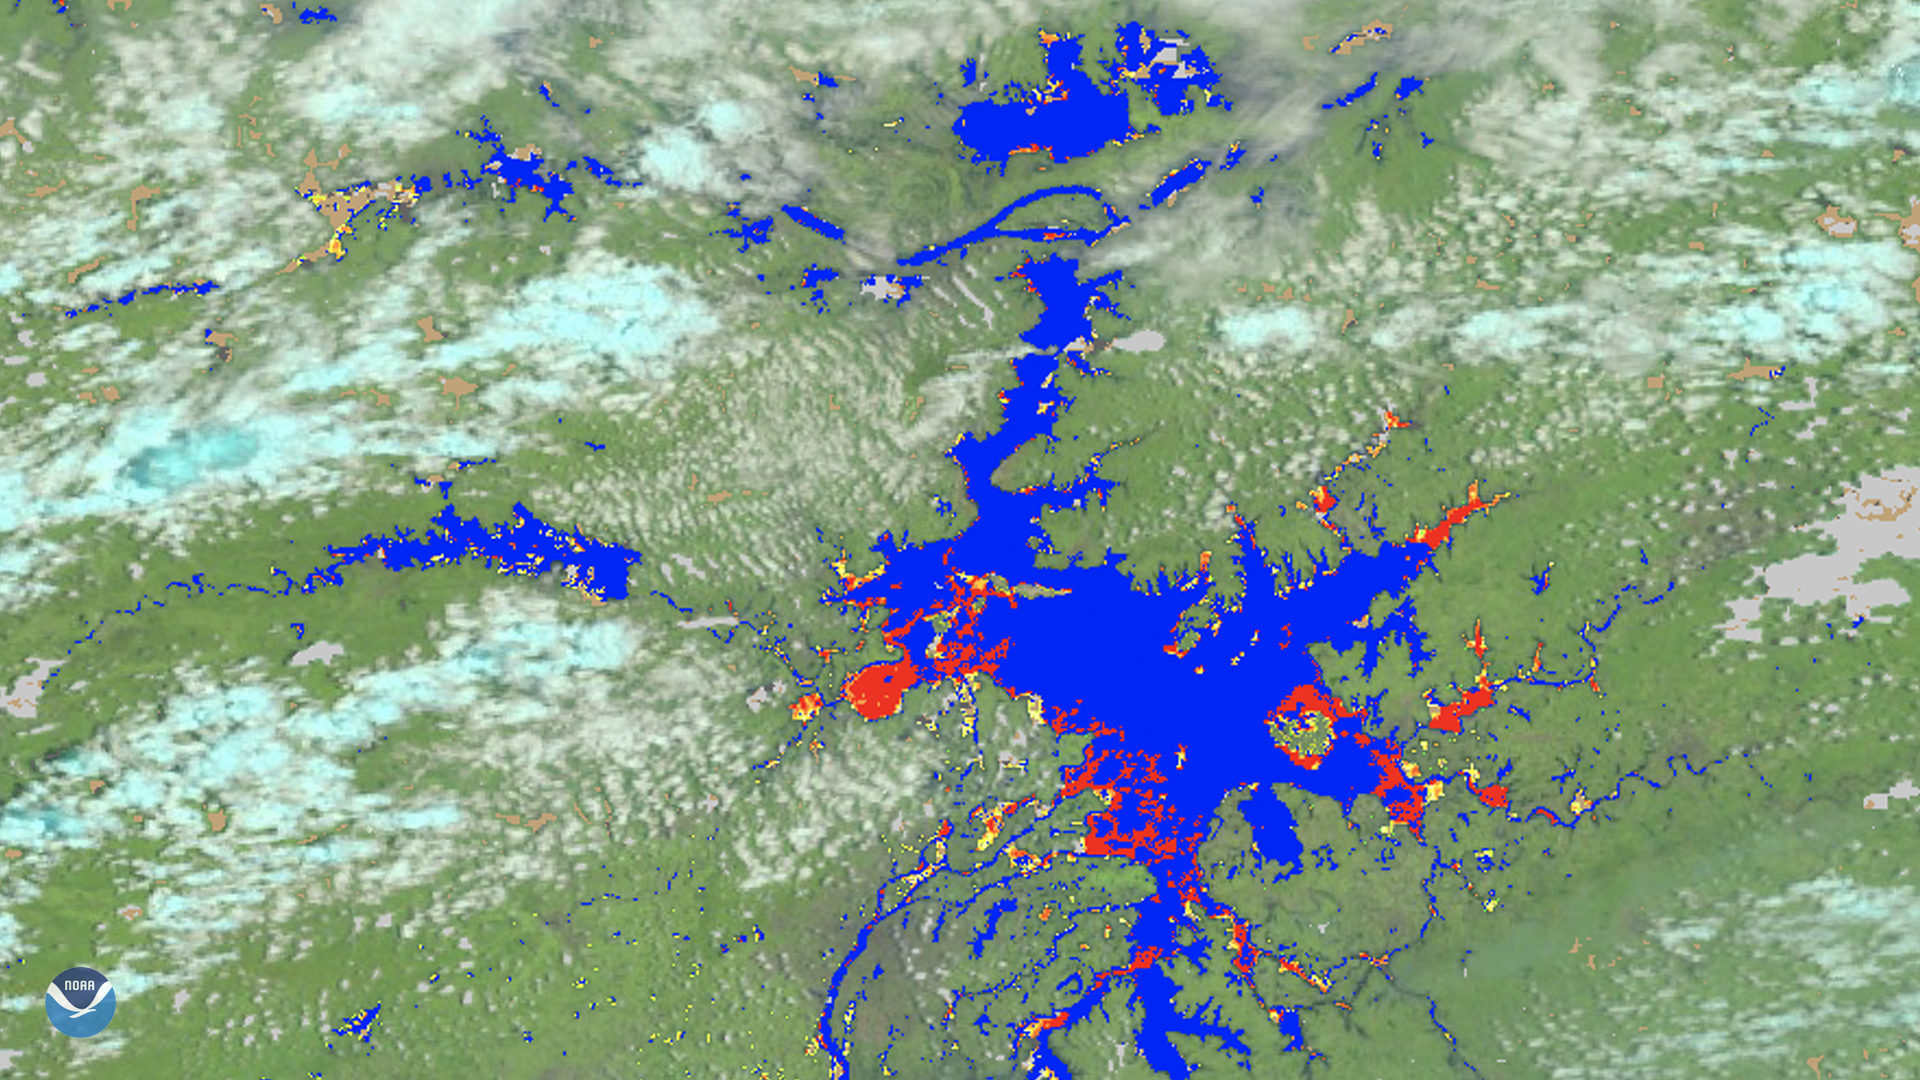
This superimposed VIIRS imagery (from Dr. Sanmei Li of George Mason University) on July 14 over the Poyang Lake Basin shows the area at 375-meter resolution, with flood-affected areas in yellow and severely flooded areas shaded in red. This basin, in particular, has seen record floodwater, causing the dam walls around the lake to breach and 14 levees in nearby Poyang City to break.
According to the state-run China Meteorological Administration, “The water level at the lake's key Xingzi hydrological station rose to 75 feet at 10 a.m. Monday, breaking the 73.8-foot record of 1998, and well above the alert level of 62 feet.” Their National Climate Center director, Lianchun Song, added: “In the past 60 years, the frequency of heavy rain has increased significantly, with the number of days of heavy rain increasing by 3.9 percent per decade. The heavy rain in the Yangtze River Basin this time occurred under such a background."
This True-Color image was captured by the Suomi-NPP and NOAA-20 satellites’ VIIRS instrument , which scans the entire globe twice daily at a 375 to 750-meter resolution. The VIIRS sensor provides high-resolution visible and infrared imagery of Earth's atmosphere, land, and oceans, and helps atmospheric scientists monitor severe weather events such as hurricanes and tropical storms.
Where this page came from
This page was imported from NOAA Satellites (NESDIS). Published by NOAA's National Environmental Satellite, Data, and Information Service and, as a work of the United States government, in the public domain; pictures credited elsewhere are left out.
Nobody has written it yet — it is the source material at a new address, which is why search engines are asked to skip it and why no one earns from it. It is up for grabs: take it on, and it is yours to rewrite and to earn from.
Licença: CC0 1.0 (domínio público) · Adaptado de www.nesdis.noaa.gov
1
0
0
0

Comentários