Viu algo para melhorar? Proponha uma alteração.
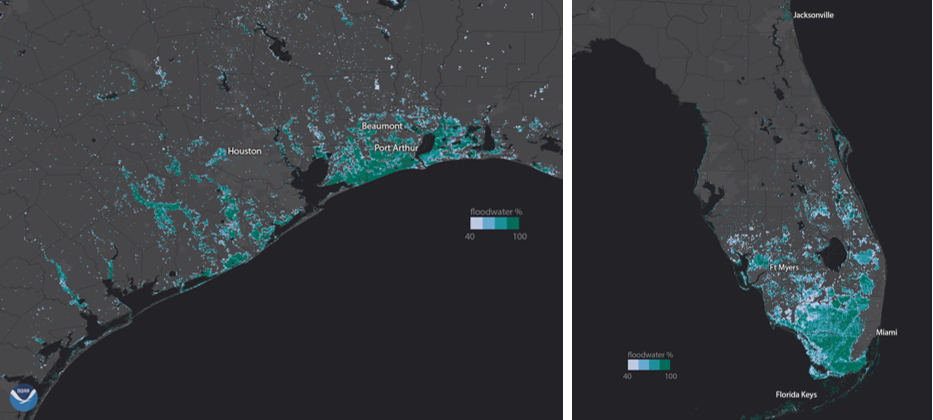
NOAA’s GOES-16 and Suomi NPP monitored the flooding caused by Hurricane Harvey & Irma. Images from the two satellites are merged to create a detailed and comprehensive flood zone map which covers vast areas. These maps help FEMA and first responders determine where to focus their efforts.

The turquoise color corresponds to areas of severe flooding.
Download Image Download image of areas of severe flooding
NOAA’s GOES-16 and Suomi NPP provide FEMA with the first comprehensive view of flood zones. When a catastrophic storm hits, the resulting floods can be deadly and cost billions of dollars in economic losses. In the US, floods are responsible for more loss of life and property than any other severe weather event. By August 30, 2017, the greater Houston area had received between 30-40 inches of rainfall from Hurricane Harvey, and the recovery effort in Texas and Louisiana is expected to cost over $100 billion. Record flooding from Hurricane Irma was recorded in Jacksonville, Florida where 356 people were rescued.

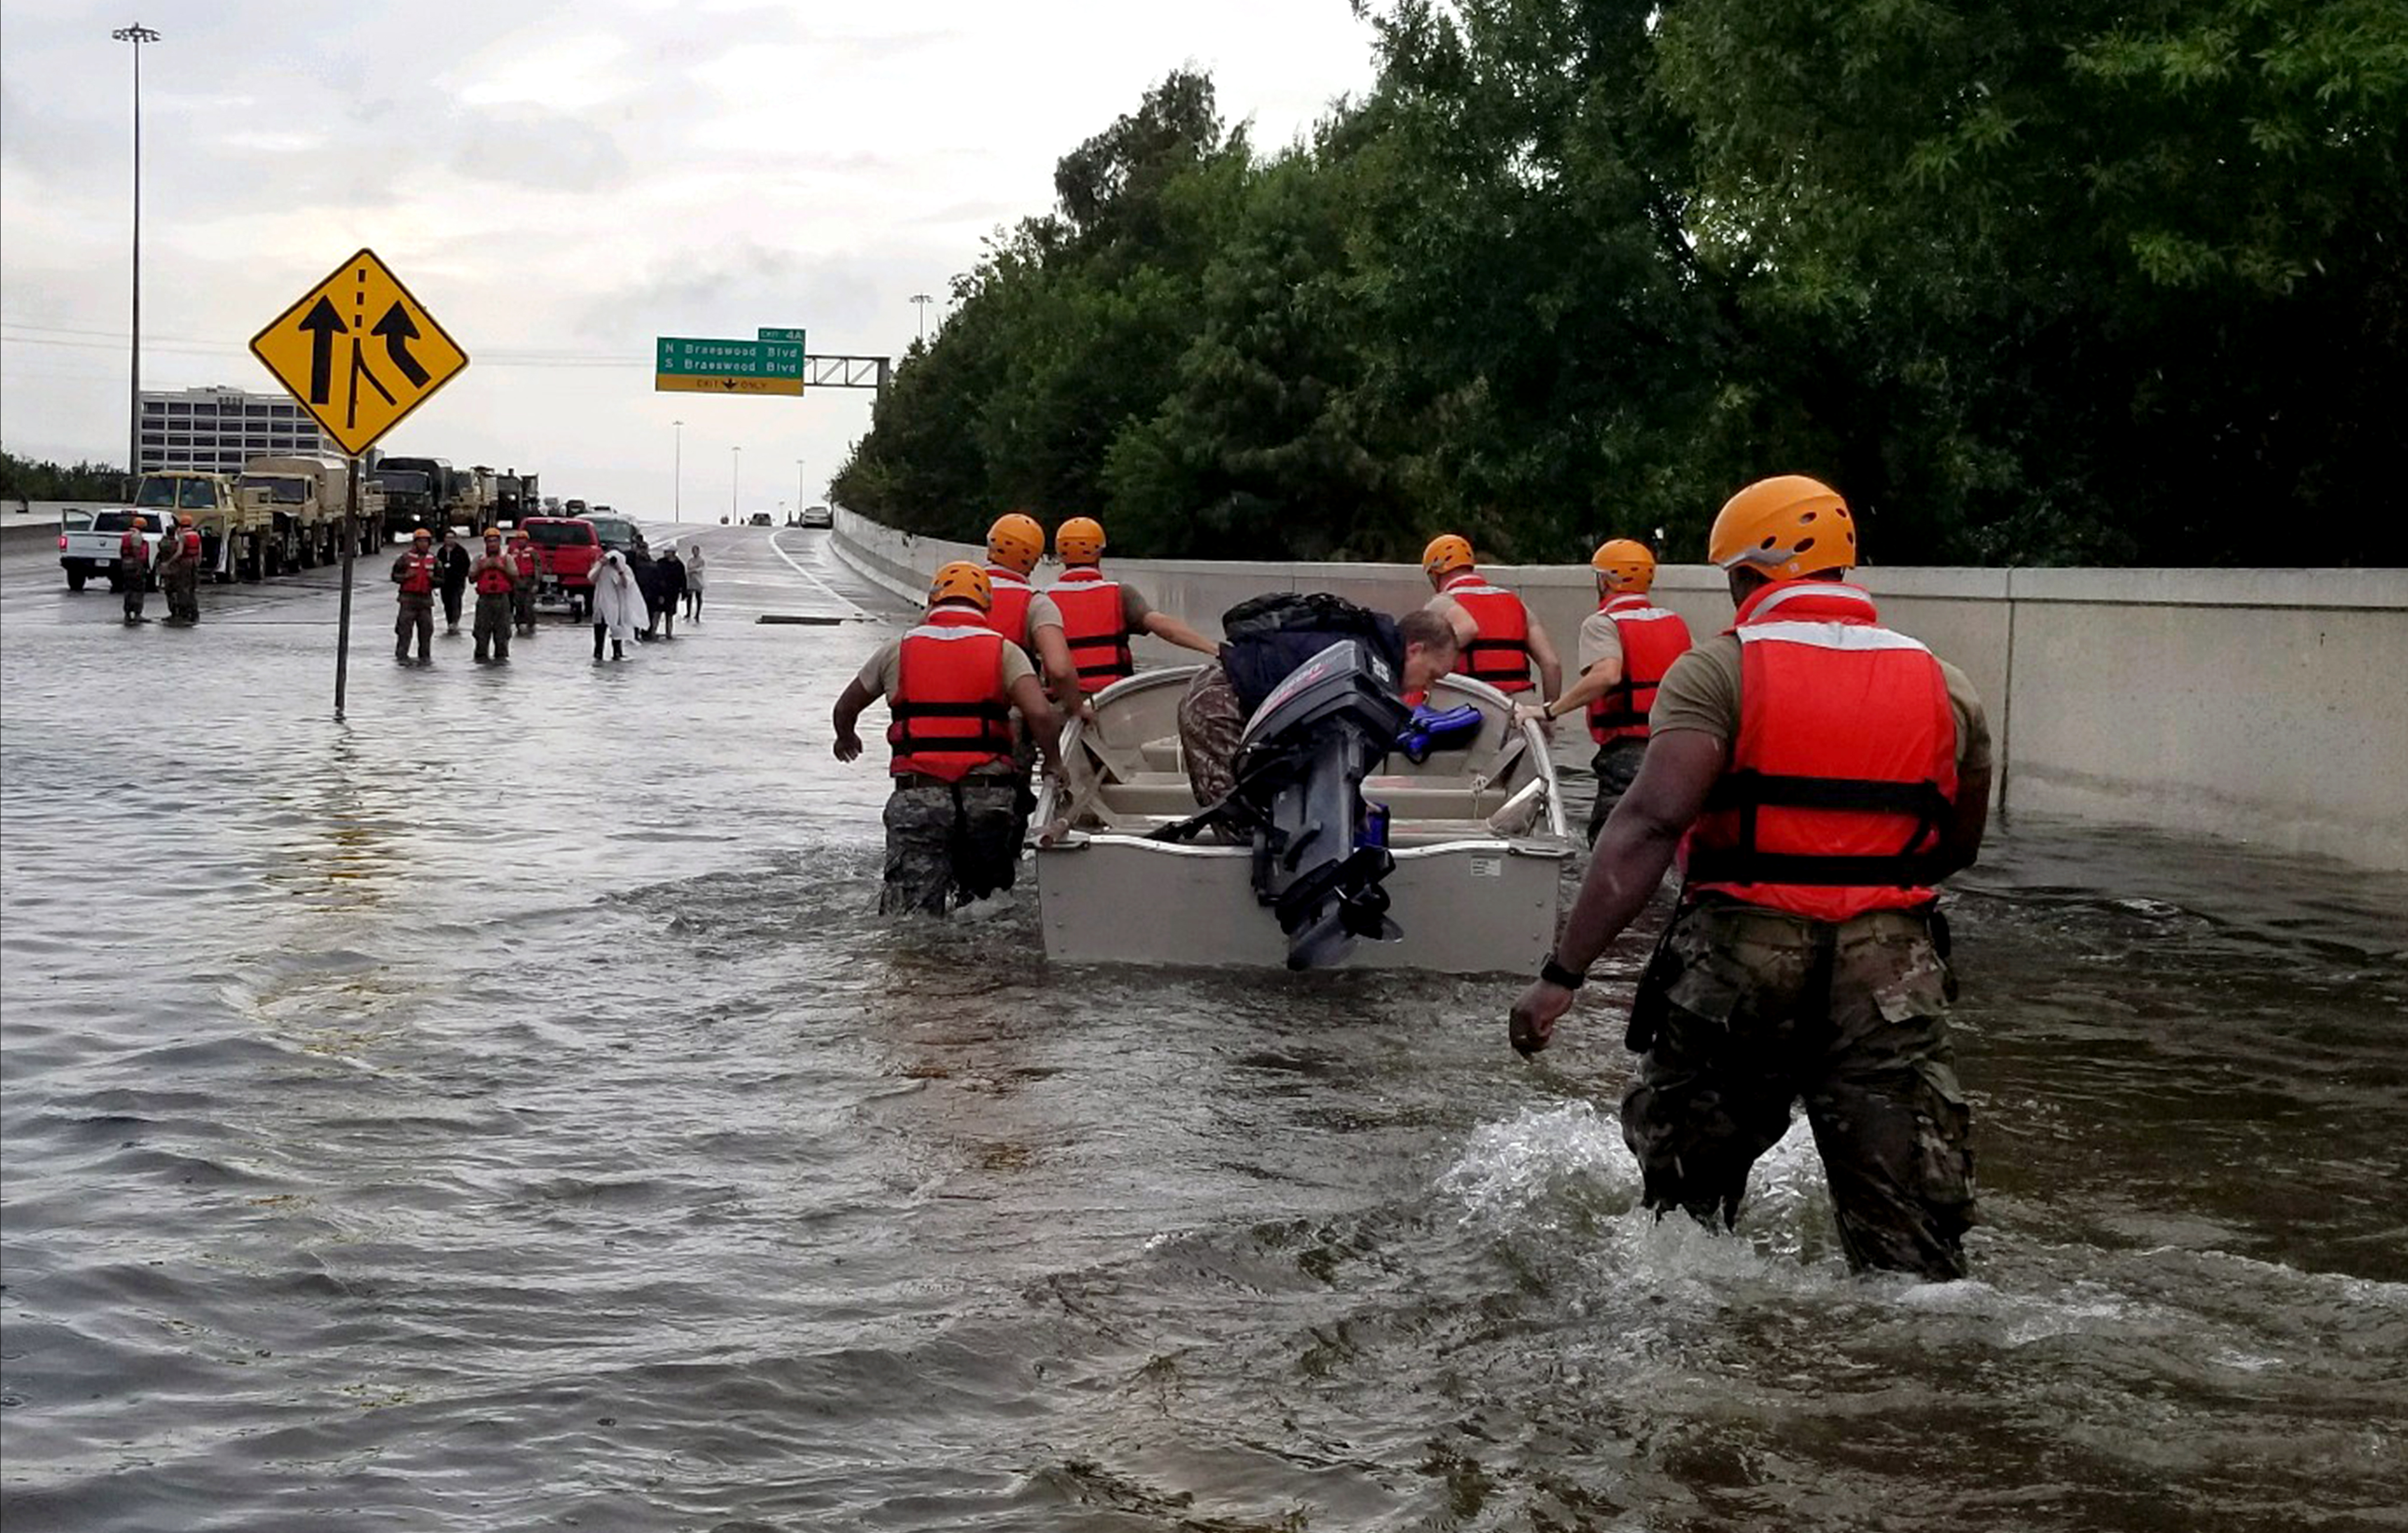
Texas National Guard soldiers arrive in Houston to aid residents in heavily flooded areas from the storms of Hurricane Harvey, Aug. 27, 2017. Texas Army National Guard photo by 1st Lt. Zachary Wes.
Download Image Download image of Texas National Guard soldiers in Houston
NOAA’s flood maps are changing how we measure the evolution and dynamics of flooding by providing high resolution detail over vast areas. This information allows teams on the ground to plan for evacuations and determine where to focus their recovery efforts.
These experimental flood maps, developed by scientists at George Mason University with NOAA support, use data from the Suomi NPP satellite’s VIIRS instrument and NOAA GOES-16 Advanced Baseline Imager. The maps allow officials to quickly determine where to employ limited resources during a flood. They also allow for insight into where water is receding. This highly valuable information is given to community officials to help them determine, in combination with other critical resources, when it is safe for people to return to their homes. The maps were provided to FEMA during the catastrophic flooding of Hurricane Harvey & Irma.
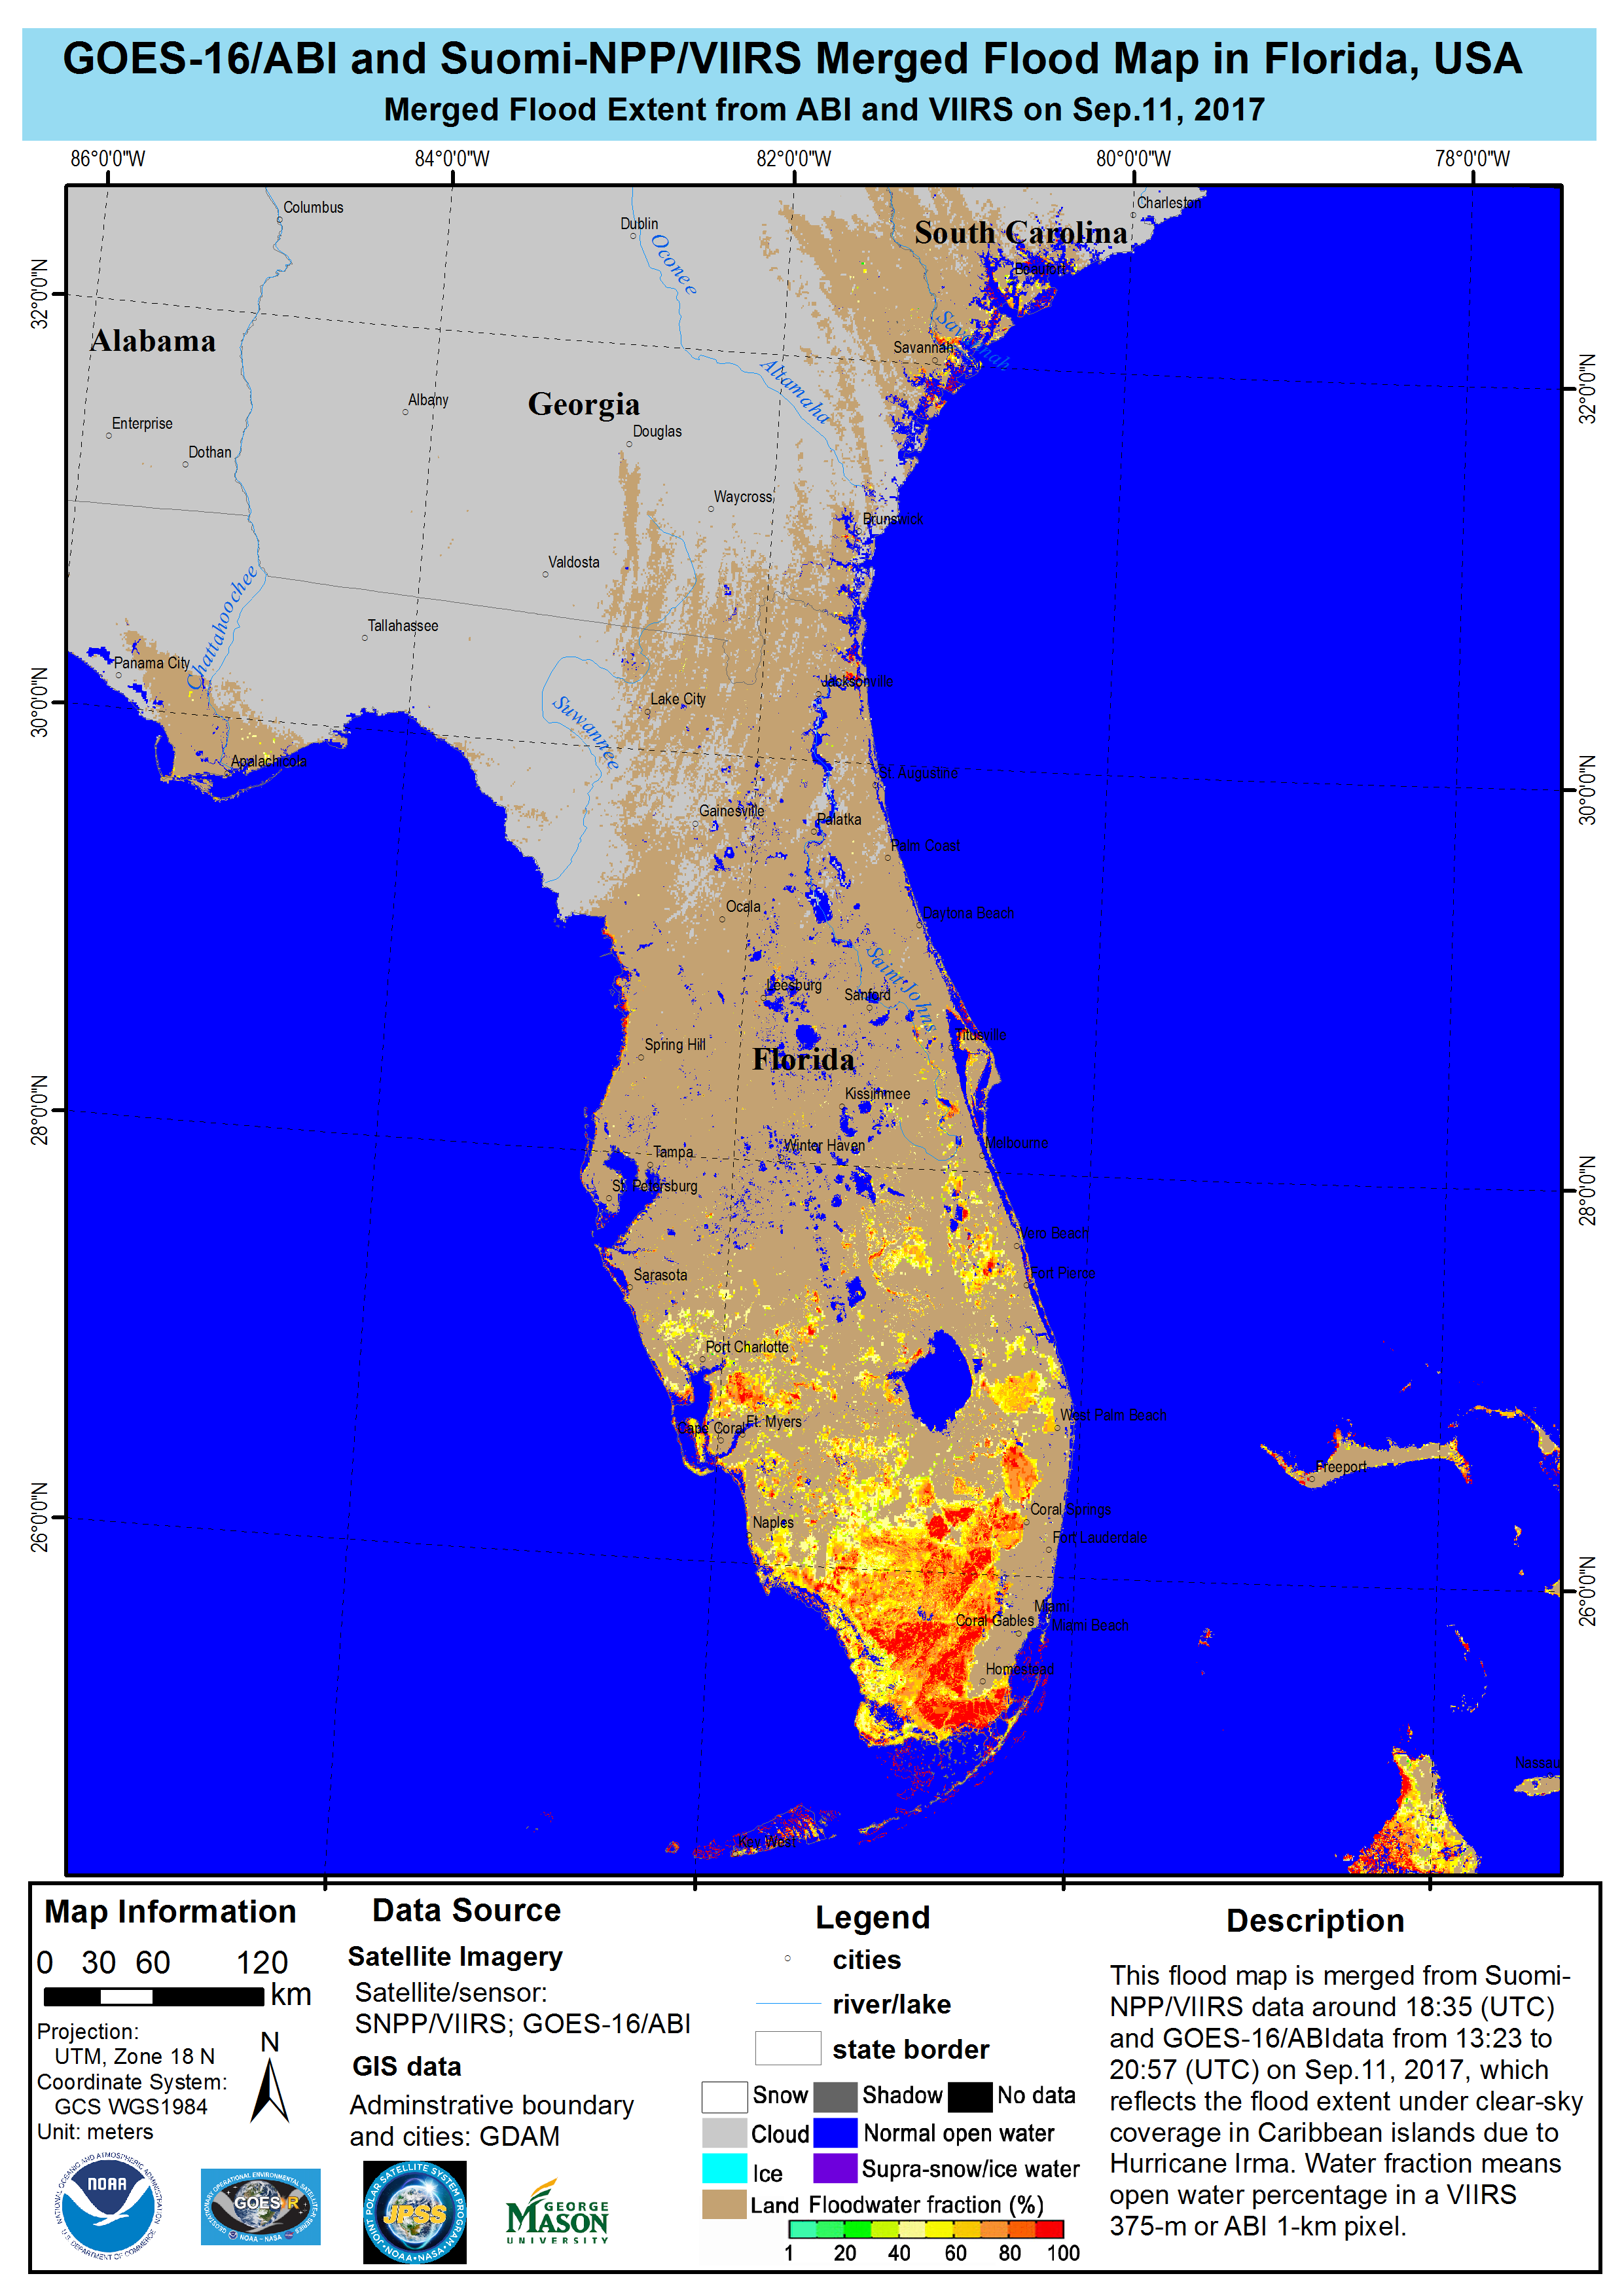
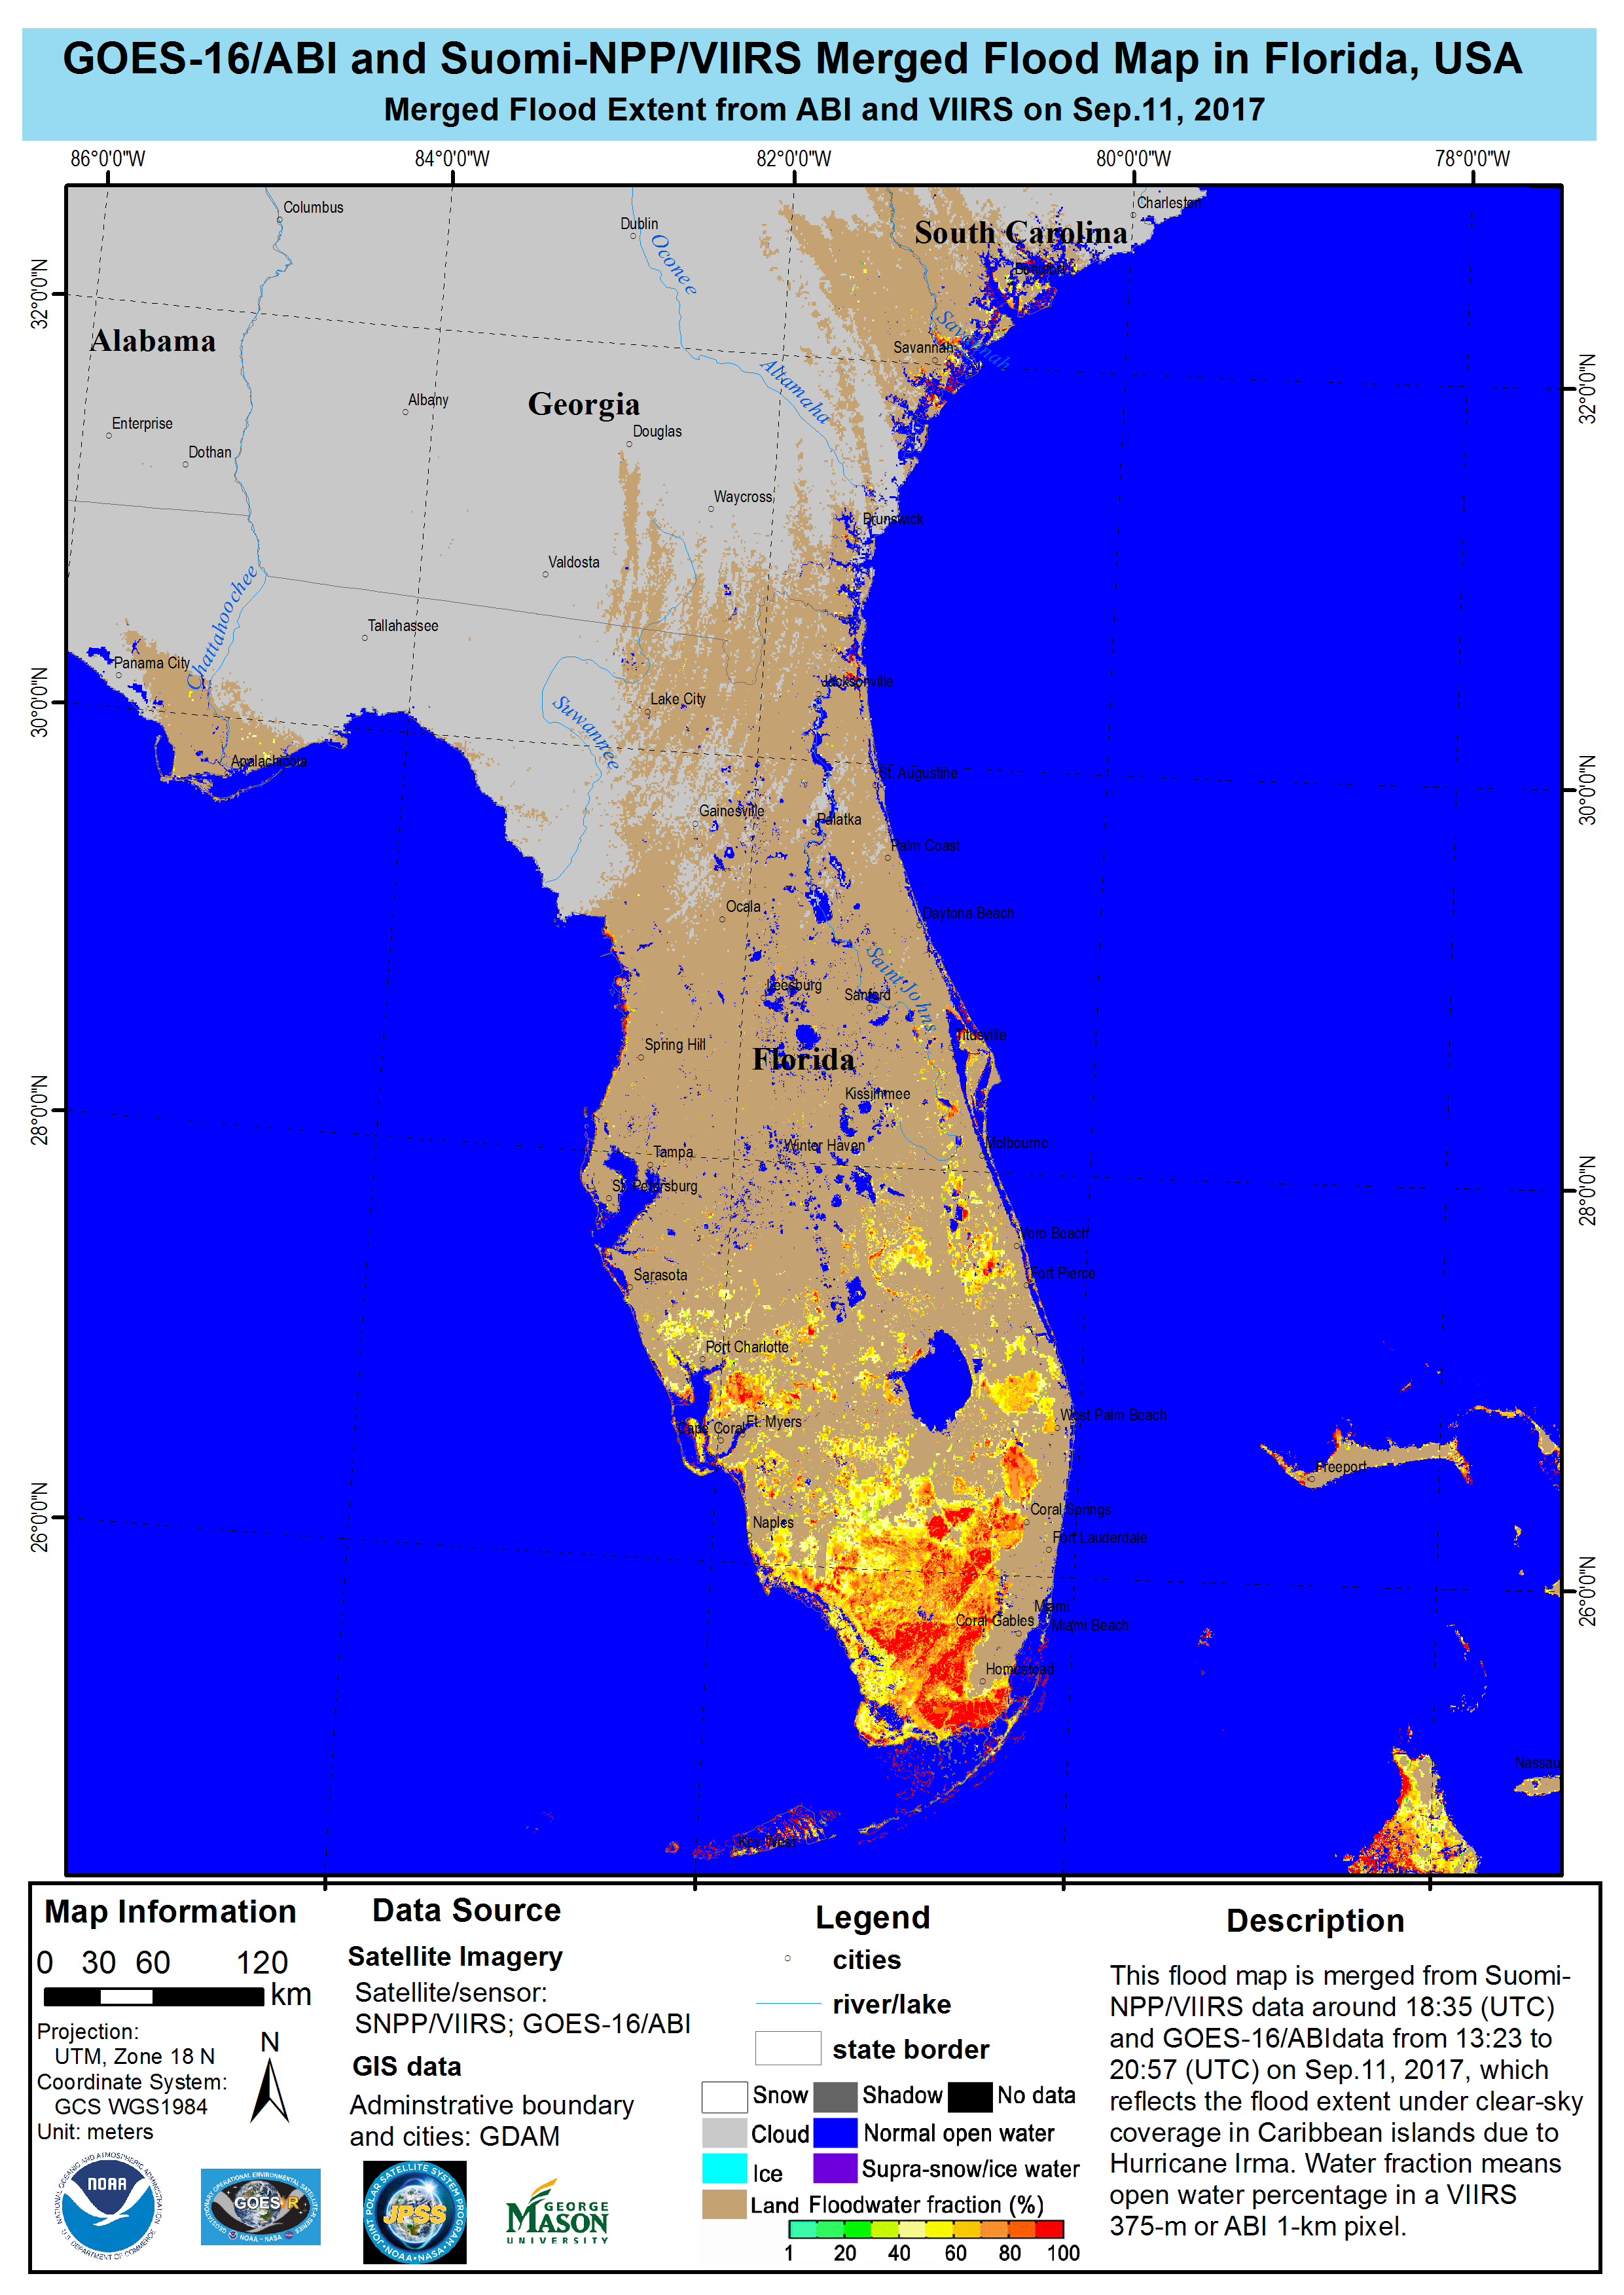
Below is the map highlighting the impact of Hurricane Irma in the State of Florida as of Sept. 11, 2017. Colors correspond to fraction of land covered by water - ranging from green - less than 30% to red - more than 90%.
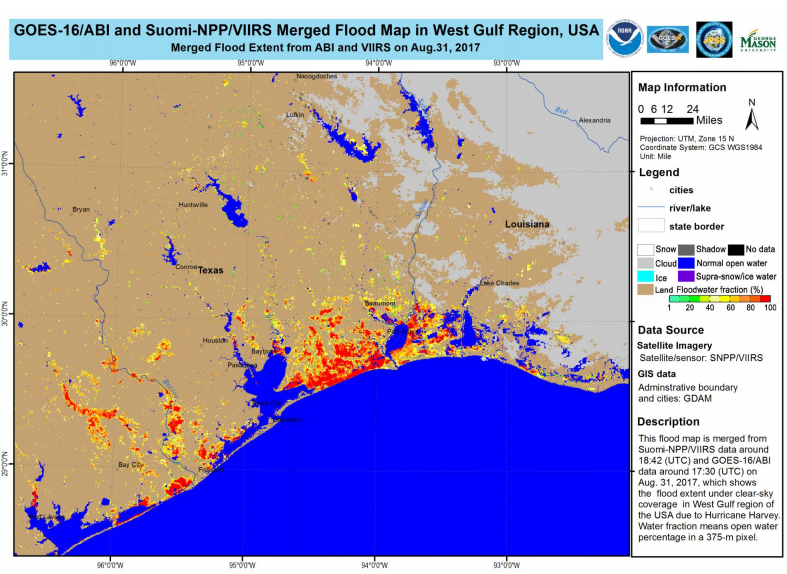
This map highlights the large areas of land flooded by Hurricane Harvey in the Gulf Region as of Aug. 31, 2017
Download Image Download map of the areas of land flooded by Hurricane Harvey

Download Image Download Floodwater map after Hurricane Harvey
Aerial Imagery
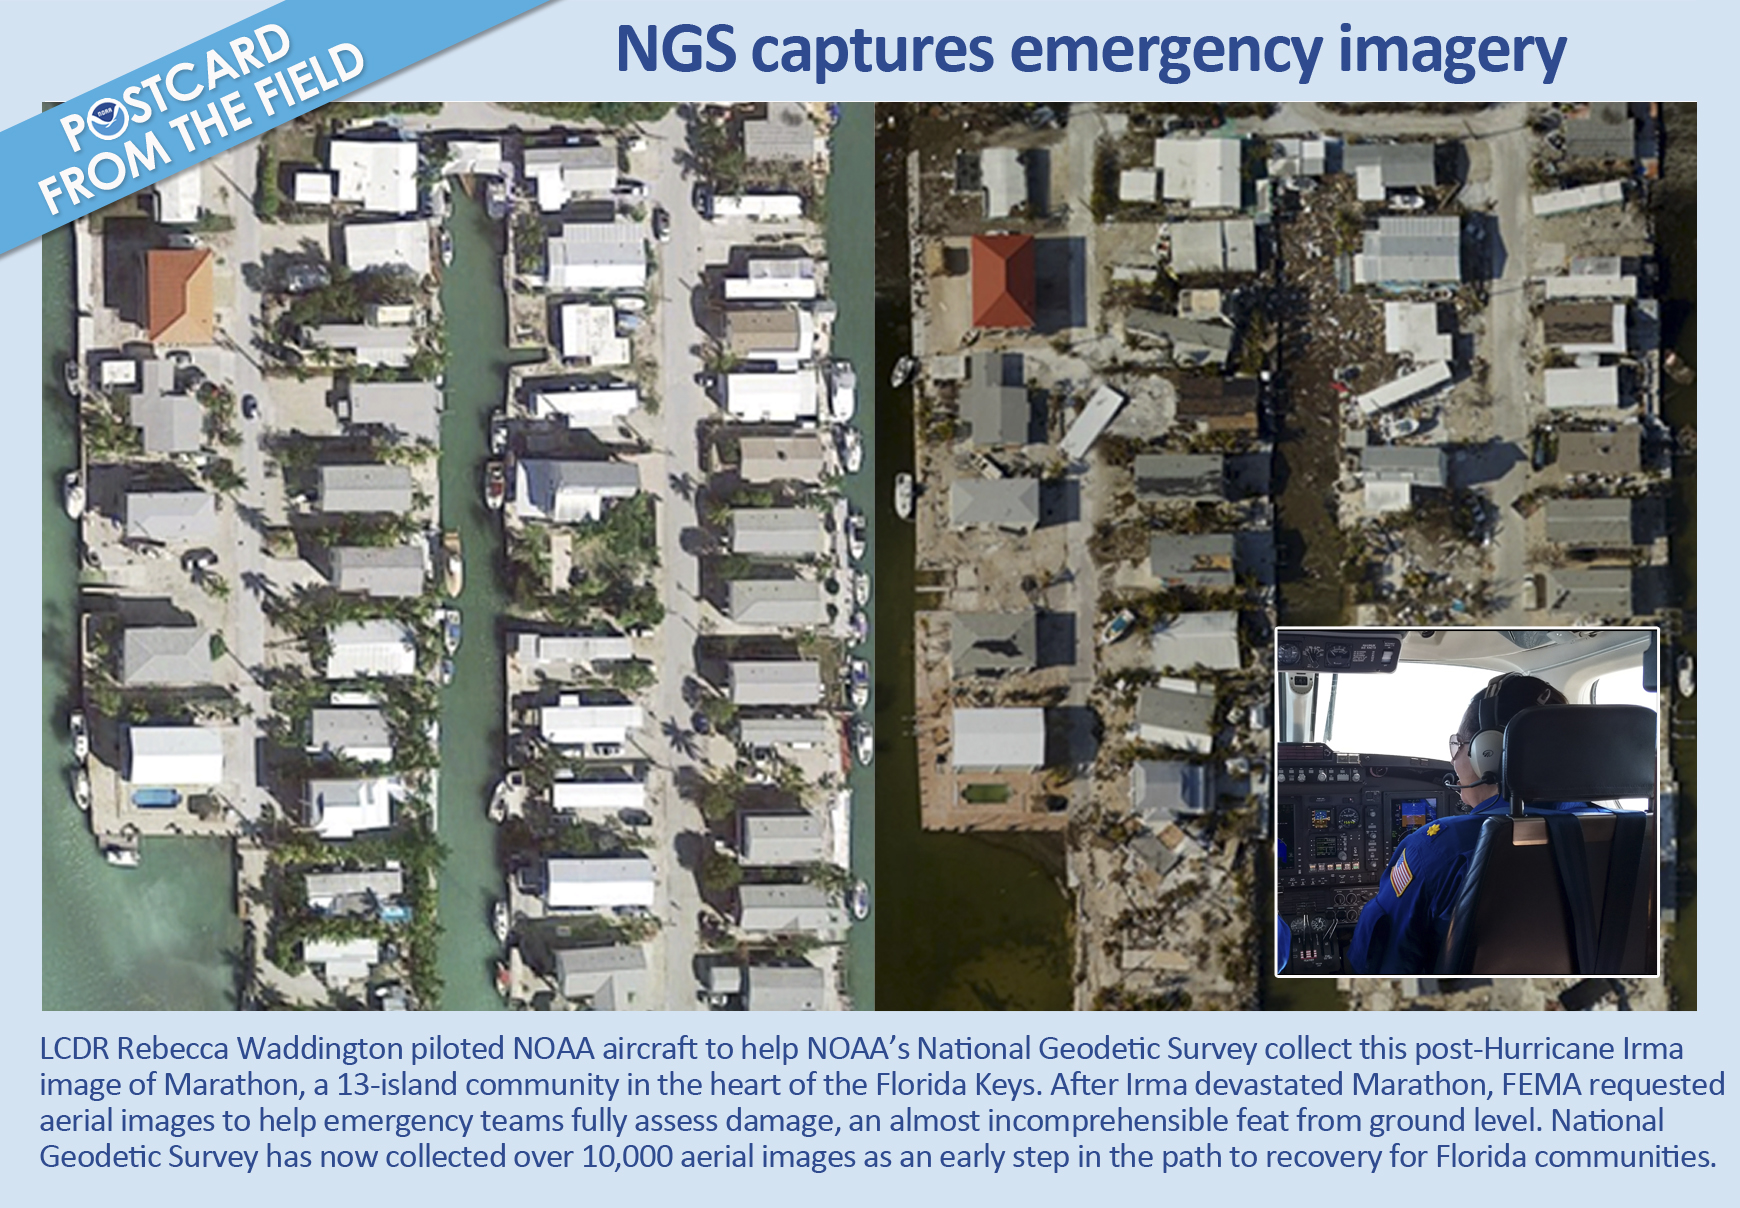
Satellite maps are used to identify where local survey teams need to focus their efforts. After a significant storm like Harvey and Irma, NOAA will also deploy aircraft to collect aerial images of flooding.
These photographs are shared with FEMA and provide a detailed local look at the flood water destruction.

Download Image Download image of flood damaged homes
Staff from NOAA's Office of Marine and Aviation Operations and NOAA’s National Geodetic Survey capture these images using specialized remote-sensing cameras aboard NOAA aircraft (primarily NOAA’s King Air and Twin Otter aircraft) flying above the area at an altitude between 1,640 and 4,921 feet. Learn more about these images or access them online.
Many offices at NOAA play a role in helping Americans stay safe, and recover, from extreme weather events such as Hurricanes Harvey and Irma. For more about NOAA, go to www.noaa.gov.
Where this page came from
This page was imported from NOAA Satellites (NESDIS). Published by NOAA's National Environmental Satellite, Data, and Information Service and, as a work of the United States government, in the public domain; pictures credited elsewhere are left out.
Nobody has written it yet — it is the source material at a new address, which is why search engines are asked to skip it and why no one earns from it. It is up for grabs: take it on, and it is yours to rewrite and to earn from.
Licença: CC0 1.0 (domínio público) · Adaptado de www.nesdis.noaa.gov
1
0
0
0

Comentários