Quer melhorar o conteúdo da página? Proponha uma alteração.
Ramakrishna Kakara, MPH1; Gwen Bergen, PhD1; Elizabeth Burns, MPH1; Mark Stevens, MA, MSPH1 (
Summary
What is already known about this topic?
Unintentional falls are the leading cause of injury and deaths from injury among adults aged ≥65 years (older adults).
What is added by this report?
In 2020, the percentage of older adults who reported falling during the previous year ranged from 19.9% in Illinois to 38.0% in Alaska. In 2021, the unintentional fall–related death rate among older adults ranged from 30.7 per 100,000 population in Alabama to 176.5 in Wisconsin.
What are the implications for public health practice?
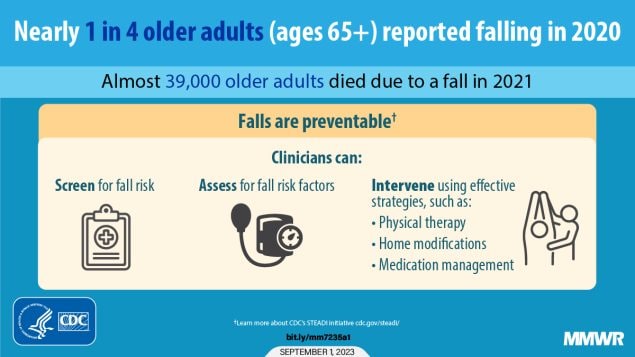
Although common, falls among older adults are preventable. Health care providers can talk with patients about their fall risk and how falls can be prevented.
Tables
Related Materials
Close
Download Image[JPG]
Abstract
In the United States, unintentional falls are the leading cause of injury and injury death among adults aged ≥65 years (older adults). Patterns of nonfatal and fatal falls differ by sex and state. To describe this variation, data from the 2020 Behavioral Risk Factor Surveillance System and 2021 National Vital Statistics System were used to ascertain the percentage of older adults who reported falling during the previous year and unintentional fall-related death rates among older adults. Measures were stratified by demographic characteristics, U.S. Census Bureau region, and state. In 2020, 14 million (27.6%) older adults reported falling during the previous year. The percentage of women who reported falling (28.9%) was higher than that among men (26.1%). The percentage of older adults who reported falling ranged from 19.9% (Illinois) to 38.0% (Alaska). In 2021, 38,742 (78.0 per 100,000 population) older adults died as the result of unintentional falls. The unintentional fall-related death rate was higher among men (91.4 per 100,000) than among women (68.3). The fall-related death rate among older adults ranged from 30.7 per 100,000 (Alabama) to 176.5 (Wisconsin). CDC’s Stopping Elderly Accidents, Deaths and Injuries (STEADI) initiative recommends that health care providers screen and assess older adults for fall risk and intervene using effective preventive strategies.
Introduction
Among adults aged ≥65 years (older adults) in the United States, the leading cause of injury and injury deaths is unintentional falls.* Although the estimated prevalence of nonfatal and fatal falls increases with age, falls are not an inevitable part of aging. Older adult falls can be prevented by addressing modifiable risk factors through effective preventive strategies. Nationally, the medical costs attributed to nonfatal and fatal falls in this age group amounts to approximately $50 billion every year (1). Demographic and geographic variation in the distribution of fatal falls has been reported (2). This report aims to identify the differences in nonfatal and fatal falls estimates by sex and state.
Methods
This report used 2020 Behavioral Risk Factor Surveillance System (BRFSS) data and 2021 National Vital Statistics System (NVSS) data, the latest years available for each source. BRFSS is a landline/mobile telephone survey which collects information about health-related behavioral risk factors and chronic conditions from noninstitutionalized adults aged ≥18 years residing in the 50 U.S. states, the District of Columbia (DC), and U.S. territories.† BRFSS collects fall-related data from respondents aged ≥45 years using the question, “In the past 12 months, how many times have you fallen?” Responses ranged from zero to 76 falls. A dichotomous variable was created to calculate the percentage of adults aged ≥65 years residing in the 50 states and DC who reported one or more fall. Accounting for complex survey design, age-adjusted percentages and 95% CIs were estimated using SAS-callable SUDAAN (version 11; RTI International). Respondents with missing values or responses of “Don’t know/Not sure” or “Refused” for falls were excluded (8,297), resulting in an analytic sample size of 127,724. NVSS extracts data from death certificates filed in the 50 states and DC. CDC WONDER was used to access 2021 NVSS data to produce age-adjusted death rates and 95% CIs.§ Falls were identified as the underlying cause of death using International Classification of Diseases, Tenth Revision codes W00–W19.
Age-adjusted percentages and death rates were calculated using the direct method and 2000 U.S. Census Bureau standard population.¶ Statistical comparisons between percentages were made using two sample t-tests as appropriate for complex survey designs such as BRFSS. Death rates were compared using a z-test when counts were >100. In addition, for counts
Results
In 2020, 14 million (27.6%) older adults reported falling during the previous year (
In 2021, a total of 38,742 (78.0 per 100,000) unintentional fall–related deaths occurred among older adults. The fall-related death rate was higher among men (91.4 per 100,000) than among women (68.3). Death rates were higher among non-Hispanic White and non-Hispanic American Indian or Alaska Native persons than among other racial and ethnic groups. Crude§§ death rates were higher in medium metro counties than in all other counties.
State-specific age-adjusted percentages of older adults reporting falls in 2020 ranged from 19.9% in Illinois to 38.0% in Alaska (
The 2021 age-adjusted fall-related death rates ranged from 30.7 per 100,000 older adults in Alabama to 176.5 in Wisconsin (Figure) and were significantly higher than the national estimate (78.0) in 26 states (Table 2). Rates were significantly higher than the national estimate in approximately 60% of Western, Midwestern, and Northeastern states and 30% of southern states and DC. Age-adjusted death rates were significantly higher among men than among women in 34 states (Table 2).
Discussion
In 2020, 14 million older adults in the United States reported falling, and in 2021, a total of 38,742 died from falls. Nationally, and in states where there were statistically significant sex-specific differences, the percentages older adults reported nonfatal falls were higher among women than among men, whereas fall-related death rates were higher among men than among women.
Similar sex differences in nonfatal and fatal falls were observed in previous years (2,3). However, the reasons for such variation are not fully understood. Possible explanations include differences in attitudes toward fall prevention and circumstances leading to falls or fall injuries. Previous studies suggest that men might be less receptive than women to fall prevention messages, and less likely to participate in fall prevention programs (4). Men are more likely than women to sustain fall-related injuries on ice or snow and while using ladders or other elevation equipment (5). In addition, the modifiable risk factors leading to fall-related injuries might differ between men and women (6).
State differences might be explained by variations in populations at high risk for falls. Because older adult falls have multiple risk factors, research into state-to-state variation in risk factor prevalences (e.g., chronic conditions, disability, and alcohol consumption), access to fall prevention activities and health care, and social determinants of health related to falls could help explain state differences.
In 2020, approximately one in four older adults reported at least one fall. Even in Illinois, the state with the lowest estimate of nonfatal falls, approximately one fifth of older adults reported falling. The 2020 estimate of nonfatal falls during the first year of the COVID-19 pandemic was similar to that during previous years (3). On average, 100 older adults died every day because of falls in 2021. The 2021 estimate of fatal falls was higher than those during the previous 20 years (7). Age-adjusted death rates have been increasing annually for at least 2 decades (7). A trend analysis using data from 2019 through 2023 (i.e., end of the COVID-19 pandemic as a public health emergency) might help identify whether death rates were affected by the pandemic.
Limitations
The findings in this report are subject to at least six limitations. First, BRFSS data are self-reported and could be subject to recall bias. Second, BRFSS does not include persons in long-term care facilities, who are at higher risk for falls. Third, additional differences might not have been identified because of small BRFSS sample sizes after stratification by sex and state. Fourth, the median response rate for the 2020 BRFSS data was 47.9%, however BRFSS data are weighted to adjust for nonresponse bias. Fifth, because the latest fall-related data in BRFSS were from 2020, nonfatal estimates from the same calendar year as the fatal estimates (2021) were not available. Finally, mortality data might be subject to misclassifications of race or ethnicity of the decedent, and might lead to over- or underestimating the rates in some groups.¶¶
Implications for Public Health Practice
CDC’s Stopping Elderly Accidents, Deaths and Injuries (STEADI) initiative (https://www.cdc.gov/steadi/about.html) recommends that health care providers screen older adults for risk of falling, assess those at risk to identify modifiable risk factors, and intervene with effective strategies (e.g., physical therapy, home modification, and medication management) to address each risk factor. Evaluation of STEADI-based fall prevention in New York found that older adults at risk for falls who received strategies to address fall risk factors were less likely to be hospitalized for a fall than were those who did not (8). Health care providers can consider motivational interviewing techniques to understand attitudes toward prevention strategies (9) and inquire about daily activities that can increase their patients’ fall risks. Everyone, including state, tribal, and local health departments and organizations working with older adults can help older adults self-screen for their risk of falling, using the online falls free checkup,*** and encourage older adults to speak to their health care provider.
Acknowledgments
Briana Moreland, Amy Schumacher, National Center for Injury Prevention and Control, CDC.
Corresponding author: Ramakrishna Kakara, oaq7@cdc.gov.
1Division of Injury Prevention, National Center for Injury Prevention and Control, CDC.
All authors have completed and submitted the International Committee of Medical Journal Editors form for disclosure of potential conflicts of interest. No potential conflicts of interest were disclosed.
† https://www.cdc.gov/brfss/annual_data/annual_2020.html
§ https://wonder.cdc.gov/ucd-icd10.html
¶ https://www.cdc.gov/nchs/data/statnt/statnt20.pdf
** 45 C.F.R. part 46.102(l)(2), 21 C.F.R. part 56; 42 U.S.C. Sect. 241(d); 5 U.S.C. Sect. 552a; 44 U.S.C. Sect. 3501 et seq.
†† Status follows the CDC’s National Center for Health Statistics 2013 Urban-Rural Classification Scheme for Counties. https://www.cdc.gov/nchs/data/series/sr_02/sr02_166.pdf
§§ 2021 death rates by urban-rural continuum were crude rates because age-adjusted rates are currently not available in CDC WONDER. https://wonder.cdc.gov/wonder/help/ucd-expanded.html#Constraints-Rates
¶¶ https://wonder.cdc.gov/wonder/help/ucd-expanded.html
*** https://www.ncoa.org/article/falls-free-checkup
References
- Florence CS, Bergen G, Atherly A, Burns E, Stevens J, Drake C. Medical costs of fatal and nonfatal falls in older adults. J Am Geriatr Soc 2018;66:693–8. https://doi.org/10.1111/jgs.15304 PMID:29512120
- Burns E, Kakara R. Deaths from falls among persons aged ≥65 years—United States, 2007–2016. MMWR Morb Mortal Wkly Rep 2018;67:509–14. https://doi.org/10.15585/mmwr.mm6718a1 PMID:29746456
- Moreland B, Kakara R, Henry A. Trends in nonfatal falls and fall-related injuries among adults aged ≥65 years—United States, 2012–2018. MMWR Morb Mortal Wkly Rep 2020;69:875–81. https://doi.org/10.15585/mmwr.mm6927a5 PMID:32644982
- Sandlund M, Skelton DA, Pohl P, Ahlgren C, Melander-Wikman A, Lundin-Olsson L. Gender perspectives on views and preferences of older people on exercise to prevent falls: a systematic mixed studies review. BMC Geriatr 2017;17:58. https://doi.org/10.1186/s12877-017-0451-2 PMID:28212622
- Timsina LR, Willetts JL, Brennan MJ, et al. Circumstances of fall-related injuries by age and gender among community-dwelling adults in the United States. PLoS One 2017;12:e0176561. https://doi.org/10.1371/journal.pone.0176561 PMID:28472065
- Ek S, Rizzuto D, Fratiglioni L, et al. Risk factors for injurious falls in older adults: the role of sex and length of follow‐up. J Am Geriatr Soc 2019;67:246–53. https://doi.org/10.1111/jgs.15657 PMID:30496601
- Kakara RS, Lee R, Eckstrom EN. Cause-specific mortality among adults aged ≥65 years in the United States, 1999 through 2020. Public Health Rep 2023. Epub March 11, 2023. https://doi.org/10.1177/00333549231155869 PMID:36905313
- Johnston YA, Bergen G, Bauer M, et al. Implementation of the stopping elderly accidents, deaths, and injuries initiative in primary care: an outcome evaluation. Gerontologist 2019;59:1182–91. https://doi.org/10.1093/geront/gny101 PMID:30239774
- Kiyoshi-Teo H, Northrup-Snyder K, Robert Davis M, Garcia E, Leatherwood A, Seiko Izumi S. Qualitative descriptions of patient perceptions about fall risks, prevention strategies and self-identity: analysis of fall prevention motivational interviewing conversations. J Clin Nurs 2020;29:4281–8. https://doi.org/10.1111/jocn.15465 PMID:32810908
| Characteristic | No. reporting ≥1 fall § | Age-adjusted % reporting ≥1 fall (95% CI) | No. of deaths | Age-adjusted fall-related death* (95% CI) |
|---|---|---|---|---|
| Total | 14,058,840 | 27.6 (27.0–28.2) | 38,742 | 78.0 (77.2–78.8) |
| Sex | ||||
| Men | 5,825,344 | 26.1 (25.2–27.0) | 18,614 | 91.4 (90.1–92.7) |
| Women | 8,233,496 | 28.9 (28.1–29.8) | 20,128 | 68.3 (67.3–69.2) |
| Age group, yrs | ||||
| 65–74 | 7,765,341 | 25.6 (24.9–26.4) | 6,409 | 19.0 (18.6–19.5) |
| 75–84 | 4,731,620 | 28.6 (27.5–29.8) | 12,136 | 74.9 (73.6–76.2) |
| ≥85 | 1,561,879 | 32.9 (31.0–34.9) | 20,197 | 338.0 (333.3–342.6) |
| Race and ethnicity ¶ | ||||
| American Indian or Alaska Native | 153,540 | 35.6 (28.9–42.3) | 155 | 57.3 (48.1–66.5) |
| Asian | 146,878 | 14.5 (9.8–19.2) | 1058 | 43.7 (41.1–46.4) |
| Black or African American | 1,100,915 | 22.6 (20.5–24.6) | 1,572 | 35.1 (33.3–36.8) |
| Native Hawaiian or other Pacific Islander | 9,373 | 21.6 (7.6–35.6) | 28 | 47.1 (31.0–68.5) |
| White | 11,244,263 | 28.8 (28.2–29.5) | 33,915 | 89.4 (88.4–90.3) |
| Hispanic or Latino | 968,611 | 24.3 (21.0–27.5) | 1,875 | 43.1 (41.1–45.1) |
| Multiple races/Other race | 193,665 | 26.1 (22.3–29.8) | 94 | 23.6 (19.0–28.9) |
| Urban/Rural status** | ||||
| Large central metro | 3,451,480 | 25.8 (24.2–27.4) | 9,005 | 60.4 (59.2–61.7) †† |
| Large fringe metro | 3,379,369 | 27.2 (26.0–28.4) | 9,714 | 69.9 (68.5–71.3) †† |
| Medium metro | 2,994,019 | 27.4 (26.3–28.5) | 9,362 | 76.9 (75.4–78.5) †† |
| Small metro | 1,486,869 | 29.5 (27.9–31.0) | 4,084 | 73.3 (71.0–75.5) †† |
| Micropolitan (nonmetropolitan) | 1,427,693 | 28.7 (27.5–29.8) | 3,878 | 73.4 (71.1–75.7) †† |
| Noncore (nonmetropolitan) | 1,319,411 | 31.4 (30.0–32.8) | 2,699 | 67.0 (64.4–69.5) †† |
† International Classification of Diseases, Tenth Revision codes W00–W19 were used to identify an unintentional fall as the underlying cause of death.
§ Nationally representative weighted number of adults aged ≥65 years reporting at least one fall in the previous year.
¶ Persons of Hispanic or Latino (Hispanic) origin might be of any race but are categorized as Hispanic; all racial groups are non-Hispanic.
** Status follows CDC’s National Center for Health Statistics 2013 Urban-Rural Classification Scheme for counties. https://www.cdc.gov/nchs/data/series/sr_02/sr02_166.pdf
†† The 2021 death rates by urban-rural continuum were crude rates because age-adjusted rates are currently not available in CDC WONDER. https://wonder.cdc.gov/wonder/help/ucd-expanded.html#Constraints-Rates
###
**Abbreviations: **DC = District of Columbia; ICD-10 = International Classification of Diseases, Tenth Revision.
- Percentages and rates were standardized to the 2000 U.S. Census Bureau standard population with age groups 65–74, 75–84, and ≥85 years using the direct method.
† Percentages and rates were categorized by tertiles into three categories.
§ ICD-10 codes W00–19 were used to identify unintentional fall as an underlying cause of death.
| Jurisdiction | Age-adjusted % reporting ≥1 fall (95% CI) | Age-adjusted fall-related death rate* (95% CI) | ||||
|---|---|---|---|---|---|---|
| Women | Men | Overall | Women | Men | Overall | |
| Overall | 28.9 (28.1–29.8) § | 26.1 (25.2–27.0) § | 27.6 (27.0–28.2) | 68.3 (67.3–69.2) § | 91.4 (90.1–92.7) § | 78.0 (77.2–78.8) |
| U.S. Census Bureau Northeast Census Region | ||||||
| Overall | 27.1 (25.5–28.6) ¶ | 25.3 (23.5–27.0) ¶ | 26.2 (25.0–27.3) ¶ | 58.0 (56.1–60.0) §,¶ | 84.9 (81.9–87.9) §,¶ | 68.9 (67.2–70.5) ¶ |
| Connecticut | 22.3 (19.3–25.4) ¶ | 21.3 (17.8–24.9) ¶ | 21.8 (19.5–24.1) ¶ | 57.8 (50.1–65.5) §,¶ | 96.8 (84.3–109.2) § | 73.5 (66.8–80.3) |
| Maine | 30.0 (27.5–32.5) | 29.4 (26.4–32.4)** | 29.6 (27.7–31.5)** | 129.0 (110.7–147.2)** | 124.0 (102.3–145.7)** | 128.0 (114.0–142.1)** |
| Massachusetts | 26.8 (23.2–30.4) | 25.6 (21.5–29.7) | 26.0 (23.3–28.6) | 78.9 (72.2–85.5) §, ** | 110.1 (100.0–120.1) §, ** | 91.0 (85.4–96.6)** |
| New Hampshire | 28.3 (25.4–31.1) | 29.5 (25.9–33.0) | 28.8 (26.6–31.1) | 87.2 (71.6–102.8) §, ** | 127.4 (103.9–150.9) §, ** | 103.6 (90.3–116.8)** |
| New Jersey | 26.4 (23.3–29.5) | 24.5 (21.1–27.9) | 25.6 (23.3–27.9) | 25.0 (21.7–28.3) §,¶ | 40.9 (35.6–46.1) §,¶ | 31.5 (28.6–34.4) ¶ |
| New York | 26.5 (23.8–29.1) | 24.1 (20.9–27.2) | 25.3 (23.3–27.3) ¶ | 42.4 (39.6–45.3) §,¶ | 59.8 (55.6–64.0) §,¶ | 49.4 (47.0–51.8) ¶ |
| Pennsylvania | 28.6 (24.1–33.1) | 27.0 (22.0–31.9) | 27.9 (24.6–31.3) | 74.3 (69.8–78.9) §, ** | 118.5 (111.4–125.7) §, ** | 92.1 (88.2–96.1)** |
| Rhode Island | 28.0 (24.2–31.8) | 23.0 (18.9–27.1) | 25.8 (23.0–28.6) | 114.1 (94.4–133.9)** | 133.2 (107.5–163.2)** | 121.5 (105.6–137.4)** |
| Vermont | 33.9 (30.1–37.7) §, ** | 27.3 (23.7–30.8) § | 31.0 (28.3–33.6)** | 118.6 (93.9–147.8) | 139.7 (106.9–179.5)** | 129.0 (107.8–150.2)** |
| U.S. Census Bureau Midwest Census Region | ||||||
| Overall | 28.0 (26.8–29.1) | 27.5 (26.1–28.9) | 27.7 (26.8–28.6) | 83.0 (80.7–85.2) §, ** | 106.6 (103.5–109.8) §, ** | 92.9 (91.1–94.7)** |
| Illinois | 20.8 (16.6–25.0) ¶ | 18.8 (13.8–23.9) ¶ | 19.9 (16.7–23.1) ¶ | 50.8 (46.7–54.9) §,¶ | 78.7 (72.3–85.1) §,¶ | 62.2 (58.6–65.7) ¶ |
| Indiana | 31.9 (29.1–34.8)** | 29.5 (26.3–32.6)** | 30.8 (28.7–32.9)** | 46.7 (41.2–52.3) §,¶ | 76.4 (67.5–85.3) §,¶ | 58.2 (53.4–63.1) ¶ |
| Iowa | 30.8 (28.1–33.6) | 29.8 (26.7–32.9)** | 30.4 (28.3–32.4)** | 97.7 (86.8–108.6)** | 106.0 (92.1–119.9)** | 102.6 (93.9–111.2)** |
| Kansas | 30.9 (28.5–33.3) | 29.0 (26.0–31.9) | 29.9 (28.1–31.8)** | 88.1 (76.8–99.3) §, ** | 119.6 (103.7–135.6) §, ** | 101.7 (92.3–111.0)** |
| Michigan | 29.5 (26.6–32.5) | 29.7 (26.0–33.4) | 29.4 (27.1–31.7) | 75.7 (70.1–81.2) §, ** | 103.4 (95.4–111.5) §, ** | 87.2 (82.6–91.9)** |
| Minnesota | 29.4 (27.1–31.7) | 28.6 (26.0–31.2) | 29.1 (27.4–30.8) | 129.8 (119.9–139.7) §, ** | 158.4 (145.1–171.8) §, ** | 141.8 (133.9–149.8)** |
| Missouri | 31.5 (28.7–34.4) | 31.1 (27.5–34.7)** | 31.3 (29.0–33.5)** | 68.6 (61.8–75.3) § | 86.3 (76.9–95.7) § | 75.7 (70.2–81.1) |
| Nebraska | 27.7 (25.5–29.9) | 27.9 (25.3–30.6) | 27.8 (26.1–29.5) | 56.1 (45.5–68.6) § | 74.9 (60.0–92.4) §,¶ | 63.4 (54.2–72.5) ¶ |
| North Dakota | 28.3 (25.0–31.6) § | 23.2 (19.6–26.8) § | 26.0 (23.6–28.4) | 82.0 (62.7–105.4) | 103.2 (76.6–136.0) | 91.7 (74.7–108.6) |
| Ohio | 28.5 (26.0–31.0) | 29.0 (26.1–31.9) | 28.5 (26.6–30.4) | 81.0 (75.7–86.2) §, ** | 98.3 (91.0–105.6) § | 88.4 (84.1–92.7)** |
| South Dakota | 31.9 (27.3–36.5) | 36.6 (29.9–43.3)** | 34.0 (30.0–38.0)** | 131.7 (106.9–156.5)** | 152.9 (121.6–189.8)** | 140.3 (120.5–160.1)** |
| Wisconsin | 27.1 (23.1–31.0) | 28.7 (24.0–33.3) | 27.5 (24.4–30.5) | 168.3 (157.4–179.1)** | 184.7 (170.7–198.6)** | 176.5 (167.9–185.1)** |
| U.S. Census Bureau South Census Region | ||||||
| Overall | 29.6 (28.3–30.8) § | 25.6 (24.2–27.1) § | 27.8 (26.8–28.7) | 67.2 (65.7–68.8) § | 90.6 (88.5–92.8) § | 77.1 (75.8–78.4) |
| Alabama | 29.9 (26.2–33.6) | 25.7 (21.5–29.9) | 28.1 (25.3–30.8) | 26.3 (21.6–31.0) §,¶ | 37.3 (30.3–44.2) §,¶ | 30.7 (26.8–34.7) ¶ |
| Arkansas | 33.6 (30.4–36.8)** | 32.9 (28.9–36.8)** | 33.1 (30.7–35.6)** | 45.7 (37.6–53.7) ¶ | 53.9 (43.3–64.5) ¶ | 49.3 (42.8–55.7) ¶ |
| Delaware | 28.1 (23.4–32.8) | 23.2 (18.3–28.1) | 26.0 (22.6–29.4) | 43.4 (31.2–58.9) ¶ | 54.2 (38.0–75.1) ¶ | 48.2 (38.1–60.2) ¶ |
| District of Columbia | 30.0 (25.0–35.1) | 29.8 (24.5–35.1) | 29.9 (26.1–33.6) | 59.9 (40.4–85.5) § | 113.5 (78.1–159.4) § | 80.4 (61.9–102.7) |
| Florida | 27.3 (23.9–30.6) § | 20.8 (17.1–24.6) §,¶ | 24.4 (21.9–26.9) ¶ | 77.6 (74.2–81.1) §, ** | 99.1 (94.6–103.6) §, ** | 87.3 (84.5–90.1)** |
| Georgia | 27.9 (24.6–31.2) | 29.3 (25.6–33.1) | 28.4 (25.9–30.8) | 48.8 (43.8–53.7) §,¶ | 73.1 (65.7–80.6) §,¶ | 58.8 (54.6–63.0) ¶ |
| Kentucky | 31.3 (26.8–35.8) | 30.9 (25.3–36.5) | 31.2 (27.7–34.7)** | 49.7 (42.7–56.8) §,¶ | 76.1 (65.4–86.7) §,¶ | 60.6 (54.6–66.6) ¶ |
| Louisiana | 30.7 (26.0–35.4) | 27.8 (23.1–32.5) | 29.4 (26.0–32.8) | 44.9 (38.2–51.6) §,¶ | 75.9 (65.1–86.7) §,¶ | 57.6 (51.7–63.5) ¶ |
| Maryland | 26.7 (24.1–29.3) | 23.2 (20.6–25.8) ¶ | 25.1 (23.3–27.0) ¶ | 72.1 (65.0–79.2) § | 100.5 (90.0–111.1) § | 83.7 (77.7–89.6) |
| Mississippi | 27.8 (25.0–30.6) | 25.0 (21.4–28.6) | 26.5 (24.3–28.8) | 63.4 (53.6–73.3) | 73.8 (60.4–87.1) ¶ | 67.9 (59.9–75.8) ¶ |
| North Carolina | 30.7 (26.6–34.8) | 26.4 (22.2–30.6) | 28.9 (25.9–31.9) | 85.3 (79.2–91.3) §, ** | 111.5 (102.8–120.1) §, ** | 95.9 (90.9–100.9)** |
| Oklahoma | 31.3 (27.8–34.7) | 27.5 (23.5–31.4) | 29.6 (27.0–32.3) | 118.4 (106.7–130.1) §, ** | 146.7 (131.0–162.5) §, ** | 130.6 (121.2–140.1)** |
| South Carolina | 29.5 (25.4–33.6) | 27.6 (22.5–32.7) | 28.5 (25.3–31.7) | 68.1 (60.5–75.7) § | 92.2 (81.4–103.0) § | 78.1 (71.9–84.4) |
| Tennessee | 35.0 (30.5–39.4) §, ** | 26.5 (21.4–31.5) § | 31.2 (27.9–34.5)** | 74.2 (67.3–81.2) § | 103.8 (93.6–114.1) §, ** | 85.9 (80.1–91.7)** |
| Texas | 30.8 (26.4–35.2) | 27.0 (22.3–31.7) | 29.0 (25.8–32.3) | 57.9 (54.4–61.3) §,¶ | 75.1 (70.4–79.8) §,¶ | 65.1 (62.3–67.9) ¶ |
| Virginia | 28.0 (25.3–30.7) | 24.6 (21.4–27.8) | 26.4 (24.3–28.5) | 64.7 (58.8–70.6) § | 100.1 (91.2–109.1) § | 79.4 (74.4–84.4) |
| West Virginia | 33.1 (29.9–36.3)** | 33.1 (29.2–37.0)** | 33.1 (30.6–35.6)** | 120.3 (104.3–136.3) §, ** | 152.1 (130.5–173.6) §, ** | 133.7 (120.8–146.6)** |
| U.S. Census Bureau West Census Region | ||||||
| Overall | 30.4 (27.9–32.9) § | 26.1 (23.6–28.7) § | 28.4 (26.6–30.1) | 64.3 (62.3–66.3) §,¶ | 83.9 (81.3–86.6) §,¶ | 72.8 (71.2–74.4) ¶ |
| Alaska | 40.3 (33.8–46.8)** | 35.6 (29.2–42.0)** | 38.0 (33.4–42.6)** | 78.3 (51.6–113.9) | 81.2 (51.5–121.9) | 80.1 (59.6–105.3) |
| Arizona | 27.5 (24.1–30.8) | 27.0 (23.5–30.5) | 27.3 (24.8–29.7) | 83.3 (76.2–90.4)** | 88.9 (80.8–97.0) | 86.1 (80.7–91.4)** |
| California | 30.6 (25.6–35.7) § | 23.2 (18.0–28.4) § | 27.1 (23.4–30.7) | 34.0 (32.0–36.0) §,¶ | 55.6 (52.5–58.7) §,¶ | 43.1 (41.3–44.8) ¶ |
| Colorado | 30.0 (27.2–32.9) | 31.2 (28.1–34.2)** | 30.5 (28.5–32.6)** | 117.1 (106.6–127.6) §, ** | 150.0 (135.6–164.4) §, ** | 130.7 (122.2–139.2)** |
| Hawaii | 22.9 (19.6–26.2) ¶ | 19.8 (16.1–23.5) ¶ | 21.5 (19.0–24.0) ¶ | 34.8 (26.3–45.2) §,¶ | 61.4 (47.9–77.4) §,¶ | 45.5 (37.6–53.3) ¶ |
| Idaho | 28.2 (24.4–32.0) | 25.5 (21.5–29.5) | 26.8 (24.1–29.6) | 115.4 (97.4–133.4)** | 123.0 (102.0–144.0)** | 119.7 (106.0–133.5)** |
| Montana | 31.8 (28.6–35.1) | 30.0 (26.4–33.5)** | 31.0 (28.6–33.4)** | 118.3 (96.6–139.9)** | 119.4 (95.8–147.1)** | 117.8 (101.7–133.9)** |
| Nevada | 29.3 (22.6–36.1) | 31.1 (23.8–38.3) | 29.9 (24.9–35.0) | 63.1 (52.6–73.5) § | 94.2 (80.0–108.3) § | 77.3 (68.7–85.9) |
| New Mexico | 33.7 (30.0–37.3)** | 33.1 (28.5–37.7)** | 33.4 (30.5–36.3)** | 88.0 (74.7–101.3)** | 94.7 (78.5–110.9) | 90.8 (80.5–101.1)** |
| Oregon | 30.5 (26.6–34.4) | 26.8 (22.7–31.0) | 29.0 (26.1–31.8) | 121.5 (110.3–132.7)** | 125.1 (111.7–138.5)** | 123.8 (115.2–132.4)** |
| Utah | 31.2 (28.3–34.1) | 28.8 (25.8–31.8) | 30.0 (27.9–32.1)** | 99.6 (84.7–114.4) §, ** | 127.4 (108.4–146.4) §, ** | 112.1 (100.3–124.0)** |
| Washington | 32.6 (29.7–35.5)** | 29.8 (26.8–32.8)** | 31.4 (29.3–33.5)** | 105.4 (97.2–113.7) §, ** | 122.8 (112.2–133.4) §, ** | 113.4 (106.9–119.9)** |
| Wyoming | 32.4 (28.8–36.1) | 30.1 (25.8–34.4) | 31.3 (28.6–34.1)** | 62.2 (41.7–89.3) | 78.4 (52.1–113.3) | 70.2 (53.3–90.7) |
† International Classification of Diseases, Tenth Revision codes W00–W19 were used to identify an unintentional fall as the underlying cause of death.
§ Statistically significant difference between women and men at p¶ Statistically lower than the national estimate at p
Where this page came from
This page was imported from Centers for Disease Control and Prevention. Material produced by the Centers for Disease Control and Prevention is a work of the United States government and is in the public domain.
Nobody has written it yet — it is the source material at a new address, which is why search engines are asked to skip it and why no one earns from it. It is up for grabs: take it on, and it is yours to rewrite and to earn from.
Licença: CC0 1.0 (domínio público) · Adaptado de www.cdc.gov
1
0
0
0

Comentários
Leia em seguida