Quer melhorar o conteúdo da página? Proponha uma alteração.
NCHS Data Brief No. 464, April 2023
PDF Version (496 KB)
Matthew F. Garnett, M.P.H., and Sally C. Curtin, M.A.
On This Page
Key findings
Data from the National Vital Statistics System
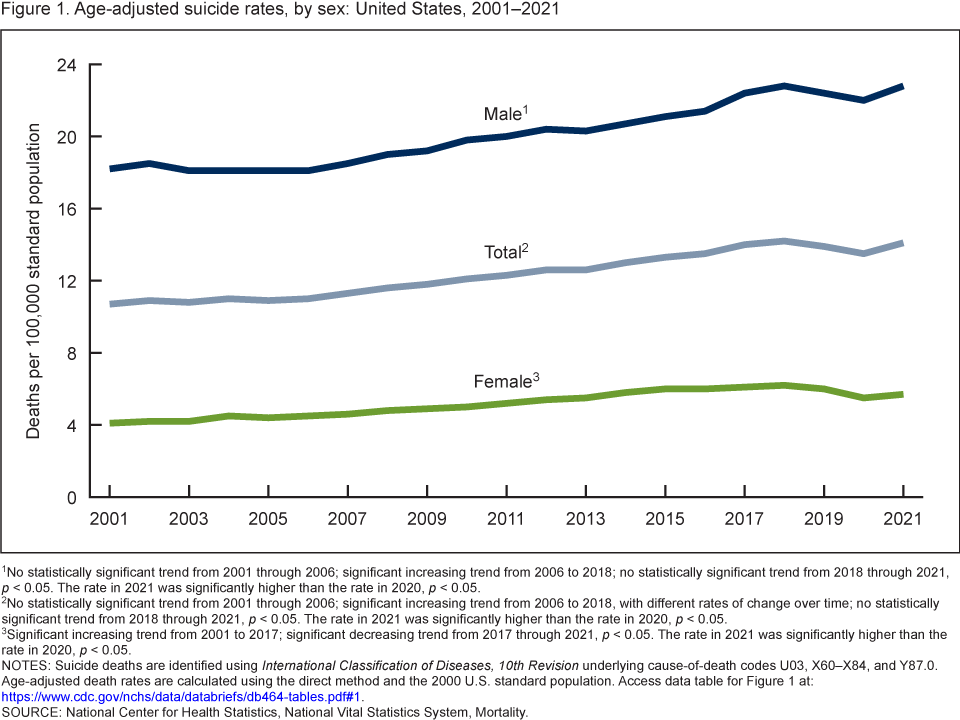
- After increasing between 2001 (10.7) and 2018 (14.2), the age-adjusted suicide rate declined for 2 years through 2020 (13.5), and then increased to 14.1 in 2021.
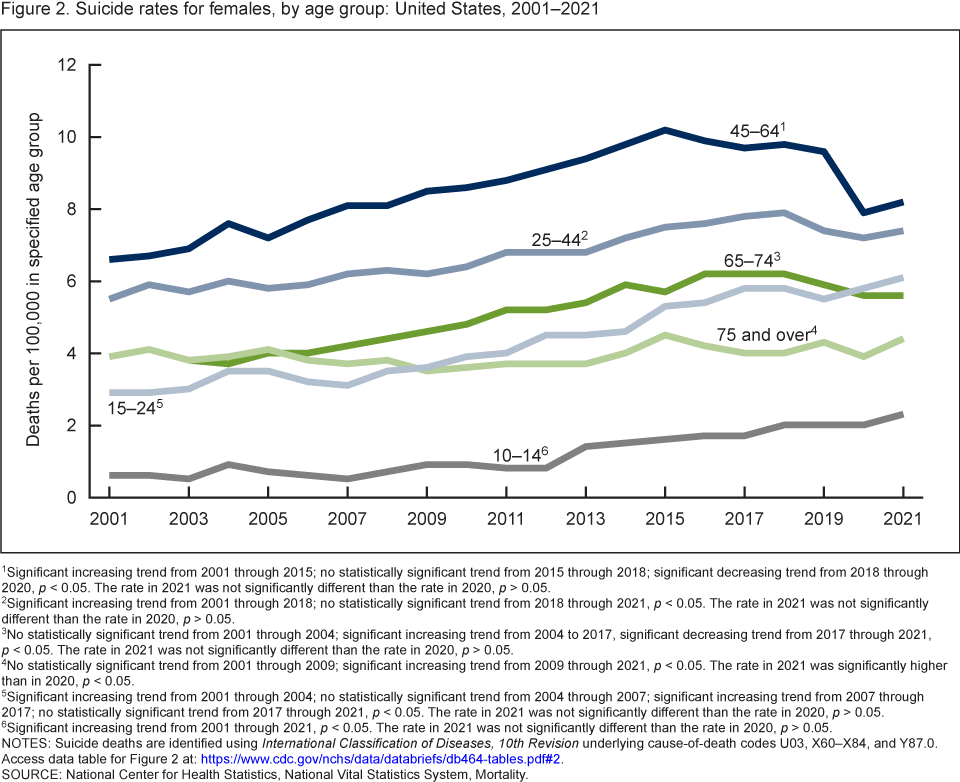
- Trends in female suicide rates varied over the period, and the observed increase between 2020 and 2021 was significant only for those aged 75 and over.
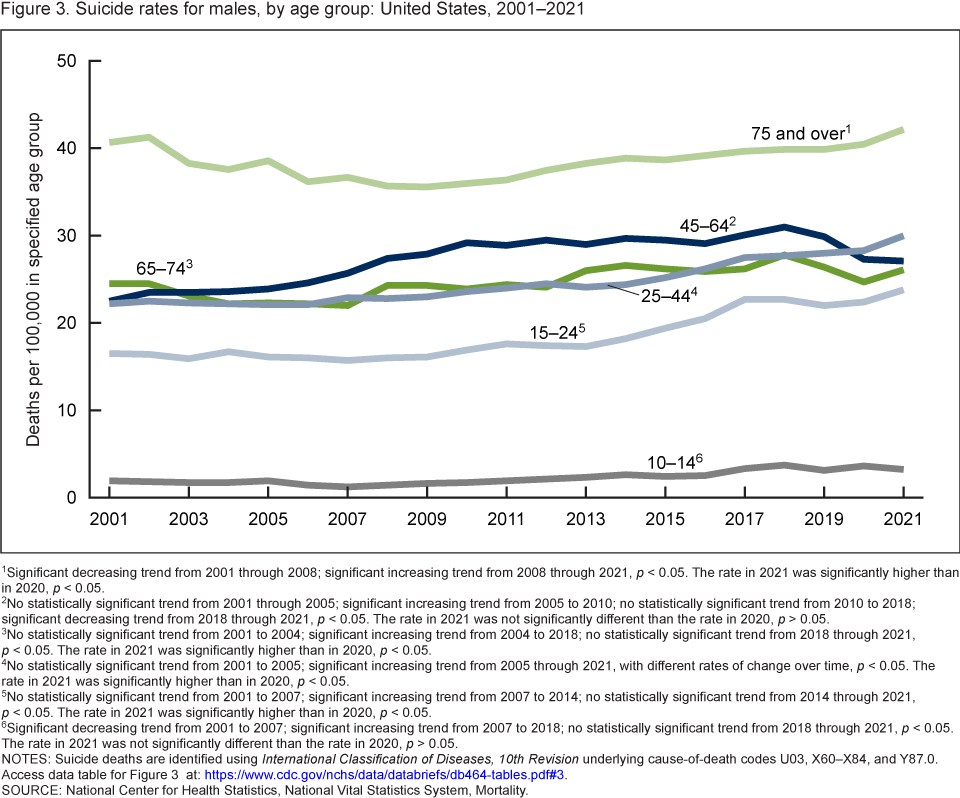
- Suicide rates significantly increased between 2020 and 2021 for males aged 15–24, 25–44, 65–74, and 75 and over.
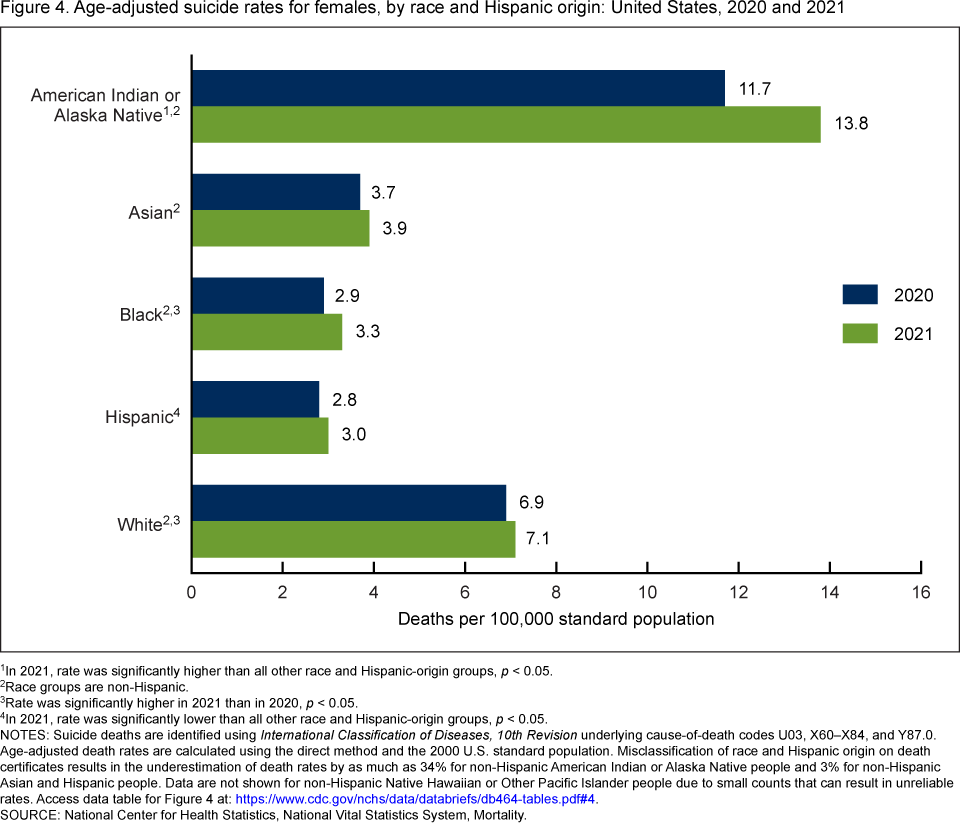
- From 2020 to 2021, suicide rates increased significantly for non-Hispanic Black (subsequently, Black) and non-Hispanic White (subsequently, White) females.
- From 2020 to 2021, suicide rates increased significantly for non-Hispanic American Indian or Alaska Native, Black, and White males.
Article Metrics
In 2021, suicide was the 11th leading cause of death in the United States, changing from the 10th leading cause in 2019 and the 12th leading cause in 2020 (
Keywords: intentional self-harm, race and Hispanic origin, mental health, suicidology, National Vital Statistics System
From 2001 through 2021, suicide rates increased most years for males and females.
- The total age-adjusted suicide rate increased from 10.7 deaths per 100,000 standard population in 2001 to a recent peak of 14.2 in 2018, and then declined to 13.5 in 2020. In 2021, the rate increased 4% to 14.1, the largest 1-year increase during the period (
- The suicide rate for males did not change significantly from 2001 (18.2) through 2006 (18.1), and then increased to 22.8 in 2018. Rates declined in 2019 (22.4) and 2020 (22.0) but then increased 4% in 2021 (22.8).
- The suicide rate for females increased from 2001 (4.1) through 2015 (6.0) and then did not change significantly through 2018 (6.2). Following a 2-year decline to 5.5 in 2020, the rate increased 4% in 2021 (5.7).
- The suicide rate for males was three to four and one-half times the rate for females during the 2001–2021 period.
Figure 1. Age-adjusted suicide rates, by sex: United States, 2001–2021
[](https://www.cdc.gov/nchs/images/databriefs/451-500/db464-fig1.png)
1No statistically significant trend from 2001 through 2006; significant increasing trend from 2006 to 2018; no statistically significant trend from 2018 through 2021, p p 2No statistically significant trend from 2001 through 2006; significant increasing trend from 2006 to 2018, with different rates of change over time; no statistically significant trend from 2018 through 2021, p p 3Significant increasing trend from 2001 to 2017; significant decreasing trend from 2017 through 2021, p p International Classification of Diseases, 10th Revision underlying cause-of-death codes U03, X60–X84, and Y87.0. Age-adjusted death rates are calculated using the direct method and the 2000 U.S. standard population. Access data table for Figure 1.
SOURCE: National Center for Health Statistics, National Vital Statistics System, Mortality.
From 2001 through 2021, changes in suicide rates among females varied
by age.
- From 2001 through 2021, female suicide rates tended to increase, although at variable rates, for all age groups except those aged 75 and over. For females aged 75 and over, rates had periods of decline and stability across the period except for a significant increase between 2020 and 2021 (
- Suicide rates significantly decreased between 2018 and 2020 for women aged 45–64 (from 9.8 deaths per 100,000 to 7.9) and between 2017 and 2020 for women aged 65–74 (6.2 to 5.6).
- From 2020 to 2021, an increase in suicide rates for females was seen across most age groups, but only the change for those aged 75 and over was significant, increasing from 3.9 to 4.4.
- From 2001 through 2021, female suicide rates were consistently highest in those aged 45–64 and lowest in those aged 10–14. Although rates were lowest for those aged 10–14, this group experienced the largest percentage increase over this period, from 0.6 in 2001 to 2.3 in 2021.
Figure 2. Suicide rates for females, by age group: United States, 2001–2021
[](https://www.cdc.gov/nchs/images/databriefs/451-500/db464-fig2.png)
1Significant increasing trend from 2001 through 2015; no statistically significant trend from 2015 through 2018; significant decreasing trend from 2018 through 2020, p p > 0.05.
2Significant increasing trend from 2001 through 2018; no statistically significant trend from 2018 through 2021, p p > 0.05.
3No statistically significant trend from 2001 through 2004; significant increasing trend from 2004 to 2017, significant decreasing trend from 2017 through 2021, p p > 0.05.
4No statistically significant trend from 2001 through 2009; significant increasing trend from 2009 through 2021, p p 5Significant increasing trend from 2001 through 2004; no statistically significant trend from 2004 through 2007; significant increasing trend from 2007 through 2017; no statistically significant trend from 2017 through 2021, p p > 0.05.
6Significant increasing trend from 2001 through 2021, p p > 0.05.
NOTES: Suicide deaths are identified using International Classification of Diseases, 10th Revision underlying cause-of-death codes U03, X60–X84, and Y87.0. Access data table for Figure 2.
SOURCE: National Center for Health Statistics, National Vital Statistics System, Mortality.
Suicide rates for males in all age groups were higher in 2021 than in 2001, although rates for those aged 45–64 have recently declined.
- From 2020 to 2021, trends in suicide rates for males varied by age group (
- For men aged 45–64, the suicide rate declined for 3 years in a row from 2018 (31.0 deaths per 100,000) to 2021 (27.1), although the change between 2020 and 2021 was not significant.
- Significant increases in suicide rates occurred from 2020 to 2021 for males aged 15–24 (from 22.4 to 23.8), 25–44 (28.3 to 30.0), 65–74 (24.7 to 26.1), and 75 and over (40.5 to 42.2).
- From 2001 through 2021, male suicide rates were consistently highest in those aged 75 and over and lowest in those aged 10–14.
Figure 3. Suicide rates for males, by age group: United States,
2001–2021
[](https://www.cdc.gov/nchs/images/databriefs/451-500/db464-fig3.png)
1Significant decreasing trend from 2001 through 2008; significant increasing trend from 2008 through 2021, p p 2No statistically significant trend from 2001 through 2005; significant increasing trend from 2005 to 2010; no statistically significant trend from 2010 to 2018; significant decreasing trend from 2018 through 2021, p p > 0.05.
3No statistically significant trend from 2001 to 2004; significant increasing trend from 2004 to 2018; no statistically significant trend from 2018 through 2021, p p 4No statistically significant trend from 2001 to 2005; significant increasing trend from 2005 through 2021, with different rates of change over time, p p 5No statistically significant trend from 2001 to 2007; significant increasing trend from 2007 to 2014; no statistically significant trend from 2014 through 2021, p p 6Significant decreasing trend from 2001 to 2007; significant increasing trend from 2007 to 2018; no statistically significant trend from 2018 through 2021, p p > 0.05.
NOTES: Suicide deaths are identified using International Classification of Diseases, 10th Revision underlying cause-of-death codes U03, X60–X84, and Y87.0. Access data table for Figure 3.
SOURCE: National Center for Health Statistics, National Vital Statistics System, Mortality.
Suicide rates increased significantly from 2020 to 2021 for non-Hispanic Black and non-Hispanic White females.
- From 2020 to 2021, suicide rates increased 14% for non-Hispanic Black (subsequently, Black) females (from 2.9 deaths per 100,000 standard population to 3.3) and 3% for non-Hispanic White (subsequently, White) females (6.9 to 7.1) (
- From 2020 to 2021, increases in suicide rates for Hispanic females (2.8 to 3.0), non-Hispanic American Indian or Alaska Native (subsequently, American Indian or Alaska Native) females (11.7 to 13.8), and non-Hispanic Asian (subsequently, Asian) females (3.7 to 3.9) were not significant.
- In 2021, American Indian or Alaska Native females had the highest suicide rates and Hispanic females had the lowest.
Figure 4. Age-adjusted suicide rates for females, by race and Hispanic origin: United States, 2020 and 2021
[](https://www.cdc.gov/nchs/images/databriefs/451-500/db464-fig4.png)
1In 2021, rate was significantly higher than all other race and Hispanic-origin groups, p 2Race groups are non-Hispanic.
3Rate was significantly higher in 2021 than in 2020, p 4In 2021, rate was significantly lower than all other race and Hispanic-origin groups, p International Classification of Diseases, 10th Revision underlying cause-of-death codes U03, X60–X84, and Y87.0. Age-adjusted death rates are calculated using the direct method and the 2000 U.S. standard population. Misclassification of race and Hispanic origin on death certificates results in the underestimation of death rates by as much as 34% for non-Hispanic American Indian or Alaska Native people and 3% for non-Hispanic Asian and Hispanic people. Data are not shown for non-Hispanic Native Hawaiian or Other Pacific Islander people due to small counts that can result in unreliable rates. Access data table for Figure 4.
SOURCE: National Center for Health Statistics, National Vital Statistics System, Mortality.
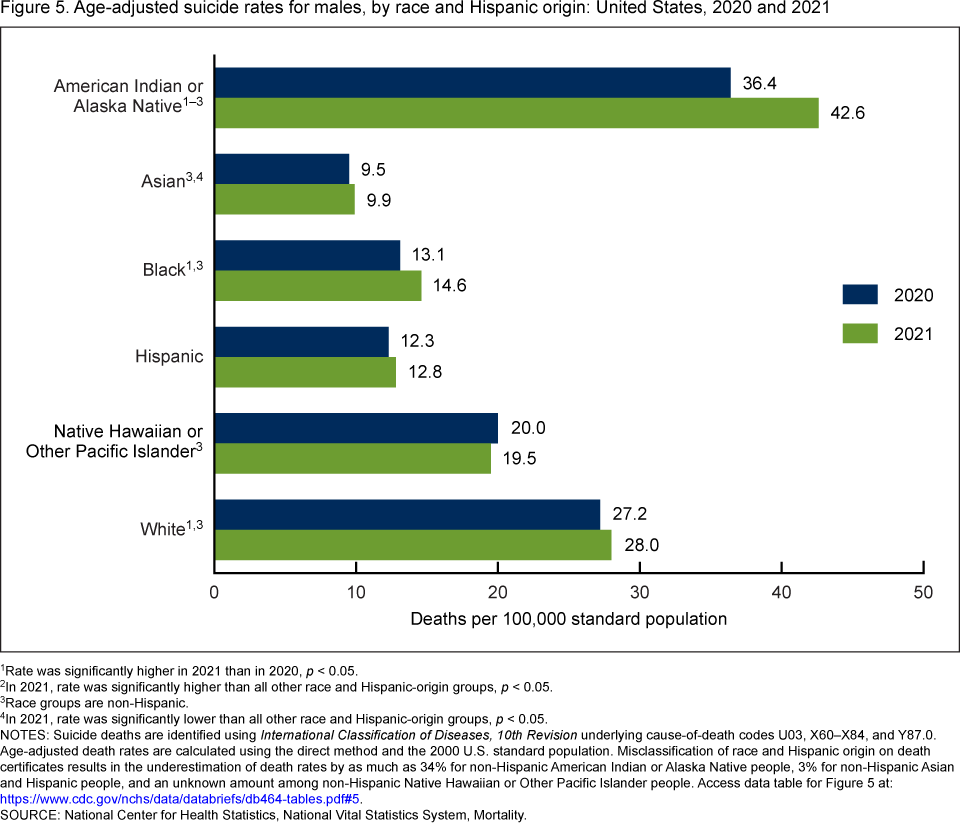
Suicide rates increased from 2020 to 2021 for American Indian or Alaska Native, Black, and White males.
- From 2020 to 2021, suicide rates increased for American Indian or Alaska Native males by 17% (from 36.4 deaths per 100,000 standard population to 42.6), for Black males by 11% (13.1 to 14.6), and for White males by 3% (27.2 to 28.0) (
- From 2020 to 2021, increases in suicide rates for Hispanic (12.3 to 12.8) and Asian (9.5 to 9.9) males were not significant. The decrease for non-Hispanic Native Hawaiian or Other Pacific Islander males (20.0 to 19.5) was also not significant.
- In 2021, American Indian or Alaska Native males had the highest rates and Asian males had the lowest.
Figure 5. Age-adjusted suicide rates for males, by race and Hispanic origin: United States, 2020 and 2021
[](https://www.cdc.gov/nchs/images/databriefs/451-500/db464-fig5.png)
1Rate was significantly higher in 2021 than in 2020, p 2In 2021, rate was significantly higher than all other race and Hispanic-origin groups, p 3Race groups are non-Hispanic.
4In 2021, rate was significantly lower than all other race and Hispanic-origin groups, p International Classification of Diseases, 10th Revision underlying cause-of-death codes U03, X60–X84, and Y87.0. Age-adjusted death rates are calculated using the direct method and the 2000 U.S. standard population. Misclassification of race and Hispanic origin on death certificates results in the underestimation of death rates by as much as 34% for non-Hispanic American Indian or Alaska Native people, 3% for non-Hispanic Asian and Hispanic people, and an unknown amount among non-Hispanic Native Hawaiian or Other Pacific Islander people.
Access data table for Figure 5.
SOURCE: National Center for Health Statistics, National Vital Statistics System, Mortality.
Summary
This report presents suicide rates in the United States from 2001 through 2021 for males and females by age and race and Hispanic origin. From 2001 to 2018, the total rate increased 33%, from 10.7 deaths per 100,000 standard population to a high of 14.2. This recent peak was followed by 2 consecutive years of declines in 2019 (13.9) and 2020 (13.5). After these declines, however, the rate increased 4% to 14.1 in 2021, the largest annual increase in the rate during the 2001–2021 period.
Data previously reported for 2019 and 2020 showed that for several subgroups, including women aged 25–74 and men aged 45–64 and 65–74, suicide rates had been declining from recent peaks seen in 2018 (
Rates for the younger age groups, 10–14 and 15–24, have generally increased over the period for both males and females. In 2021, rates for females aged 10–14, the group with the lowest rates, saw a nonsignificant increase, while a slight decline for males of the same age was also not statistically significant.
For both males and females, American Indian or Alaska Native people had the highest rates of suicide in 2021 compared with other groups. Suicide rates increased significantly from 2020 to 2021 among American Indian or Alaska Native, Black, and White males. For the same time period, rates significantly increased for Black and White females.
Data source and methods
Data were analyzed using National Vital Statistics System multiple cause-of-death mortality files for 2001 through 2021 (
Age-adjusted death rates were calculated using the direct method and the 2000 U.S. standard population (
Trends in death rates were evaluated using the Joinpoint Regression Program (4.9.0.0) (
Race and Hispanic origin were categorized based on 1997 Office of Management and Budget standards for federal statistical and administrative reporting, and differ from the bridged-race categories used for data years before 2018 (
About the authors
Matthew F. Garnett is with the National Center for Health Statistics (NCHS), Division of Analysis and Epidemiology, and Sally C. Curtin is with NCHS, Division of Vital Statistics.
References
- Centers for Disease Control and Prevention. CDC WONDER. About multiple cause of death, 1999–2020. 2022.
- Curtin SC, Garnett MF, Ahmad FB. Provisional numbers and rates of suicide by month and demographic characteristics: United States, 2021. Vital Statistics Rapid Release; no 24. September 2022. DOI: https://dx.doi.org/10.15620/cdc:120830.
- Garnett MF, Curtin SC, Stone DM. Suicide mortality in the United States, 2000–2020. NCHS Data Brief, no 433. Hyattsville, MD: National Center for Health Statistics. 2022. DOI: https://dx.doi.org/10.15620/cdc:114217.
- National Center for Health Statistics. Public-use data file documentation: Mortality multiple cause-of-death. 2020.
- World Health Organization. International statistical classification of diseases and related health problems, 10th revision (ICD–10). 2008 ed. Geneva, Switzerland. 2009.
- Kochanek KD, Murphy SL, Xu JQ, Arias E. Deaths: Final data for 2017. National Vital Statistics Reports; vol 68 no 9. Hyattsville, MD: National Center for Health Statistics. 2019.
- National Cancer Institute. Joinpoint Regression Program (Version 4.9.0.0) [computer software]. 2021.
- Ingram DD, Malec DJ, Makuc DM, Kruszon-Moran D, Gindi RM, Albert M, et al. National Center for Health Statistics guidelines for analysis of trends. National Center for Health Statistics. Vital Health Stat 2(179). 2018.
- Office of Management and Budget. Revisions to the standards for the classification of federal data on race and ethnicity. Fed Regist 62(210):58782–90. 1997.
- Arias E, Heron M, Hakes JK. The validity of race and Hispanic-origin reporting on death certificates in the United States: An update. National Center for Health Statistics. Vital Health Stat 2(172). 2016.
- Arias E, Xu JQ, Curtin S, Bastian B, Tejada-Vera B. Mortality profile of the non-Hispanic American Indian or Alaska Native population, 2019. National Vital Statistics Reports; vol 70 no 12. Hyattsville, MD: National Center for Health Statistics. 2021. DOI: https://dx.doi.org/10.15620/cdc:110370.
Suggested citation
Garnett MF, Curtin SC. Suicide mortality in the United States, 2001–2021. NCHS Data Brief, no 464. Hyattsville, MD: National Center for Health Statistics. 2023. DOI: https://dx.doi.org/10.15620/cdc:125705.
Copyright information
All material appearing in this report is in the public domain and may be reproduced or copied without permission; citation as to source, however, is appreciated.
National Center for Health Statistics
Brian C. Moyer, Ph.D., Director
Amy M. Branum, Ph.D., Associate Director for Science
Division of Analysis and Epidemiology
Irma E. Arispe, Ph.D., Director
Julie D. Weeks, Ph.D., Acting Associate Director for Science
Division of Vital Statistics
Steven Schwartz, Ph.D., Director
Andrés A. Berruti, Ph.D., M.A., Associate Director for Science
Content provided and maintained by the US Centers for Disease Control and Prevention (CDC). Please see our system usage guidelines and disclaimer.
Where this page came from
This page was imported from Centers for Disease Control and Prevention. Material produced by the Centers for Disease Control and Prevention is a work of the United States government and is in the public domain.
Nobody has written it yet — it is the source material at a new address, which is why search engines are asked to skip it and why no one earns from it. It is up for grabs: take it on, and it is yours to rewrite and to earn from.
Licença: CC0 1.0 (domínio público) · Adaptado de www.cdc.gov
1
0
0
0

Comentários
Leia em seguida