Есть что улучшить? Предложите правку.
Get tips and tricks on how to access, visualize and use Census Bureau data. The Census Academy team of data experts these Data Gems.
Some Other Race Population
The Some Other Race population was the second-largest alone or in combination race group, comprising 15.1% of the total population.
- About 27.9 million people (8.4% of all respondents) identified as Some Other Race alone in 2020, up from 19.1 million people (6.2%) in 2010.
- Coupled with the 22 million respondents who identified as Some Other Race in combination with another race group (such as White or Black or African American), the Some Other Race alone or in combination population comprised 49.9 million people.
- The Some Other Race alone population changed 46.1% and the Some Other Race in combination population changed 733% since 2010.
- Approximately 45.3 million people of Hispanic or Latino origin were classified as Some Other Race either alone or in combination, compared with only 4.6 million people who were not of Hispanic or Latino origin. Nearly all of those who were classified as Some Other Race alone were of Hispanic or Latino origin (26.2 million out of 27.9 million, or 93.9%).
The observed changes in the Some Other Race population could be attributed to a number of factors, including demographic change since 2010. But we expect they were largely due to the improvements to the design of the two separate questions for race and ethnicity, data processing and coding, which enabled a more thorough and accurate depiction of how people prefer to self-identify.
Multiracial Population
In 2020, the percentage of people who reported multiple races changed more than all of the race alone groups, increasing from 2.9% of the population (9 million people) in 2010 to 10.2% of the population (33.8 million people) in 2020.
- The largest Multiracial combinations in 2020 were White and Some Other Race (19.3 million), White and American Indian and Alaska Native (4 million), White and Black or African American (3.1 million), White and Asian (2.7 million), and Black or African American and Some Other Race (1 million).
- Between 2010 and 2020, the White and Some Other Race population added 17.6 million people to the Multiracial population, a change of over 1,000%.
- The White and American Indian and Alaska Native population also increased, growing by about 2.5 million people or 177%.
- The White and Black or African American population increased by 1.2 million people, a 67.4% change.
- The White and Asian population increased by 1.1 million people, a 65.8% change in size.
- The Black or African American and Some Other Race population increased by 722,383 people, a 230% change.
The observed changes in the Multiracial population could be attributed to a number of factors, including demographic change since 2010. But we expect they were largely due to the improvements to the design of the two separate questions for race and ethnicity, data processing, and coding, which enabled a more thorough and accurate depiction of how people prefer to self-identify.
Hispanic or Latino Origin by Race
Another way to examine data on race and ethnicity is to cross-tabulate Hispanic or Latino origin by race. As we saw with the 2010 Census, many Hispanic or Latino respondents answered the separate question on race by reporting their race as “Mexican,” “Hispanic,” “Latin American,” “Puerto Rican,” etc.
These and other responses to the race question that reflect a Hispanic or Latino origin were classified in the Some Other Race category, as people of Hispanic or Latino origin may be of any race per the 1997 OMB standards.
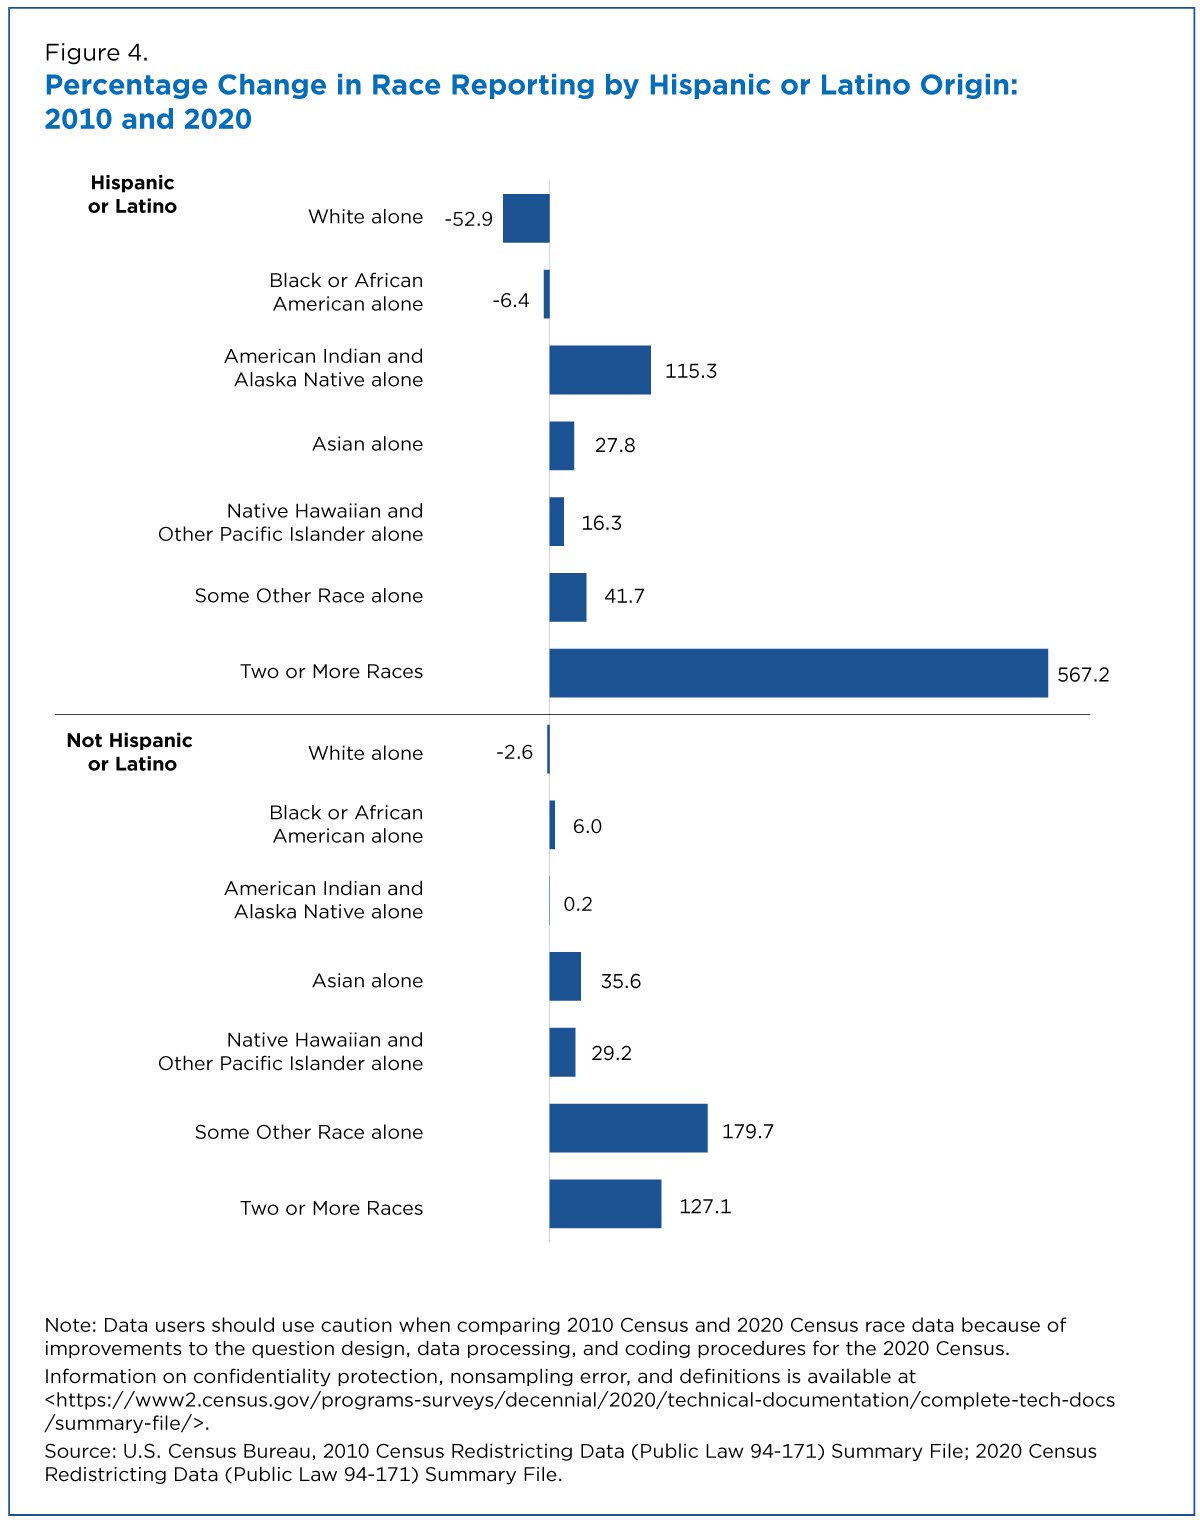
Between 2010 and 2020, the number of people of Hispanic or Latino origin reporting more than one race increased 567% from 3 million (6.0%) to 20.3 million (32.7%) (Figure 4).
We are confident these differences in racial distributions were largely due to the improvements to the design of the two separate questions for race and ethnicity, data processing, and coding, which enabled a more thorough and accurate depiction of how people prefer to self-identify.
- In 2020, among people of Hispanic or Latino origin, 26.2 million people (42.2%) identified their race as Some Other Race alone, a 41.7% change from 2010.
- The number of people of Hispanic or Latino origin who identified as White alone decreased by 52.9%, down from 26.7 million to 12.6 million over the decade.
- The number of people who were not of Hispanic or Latino origin who identified as White alone declined at a slower rate, with a -2.6% change.
Race and Hispanic Origin by Age Group
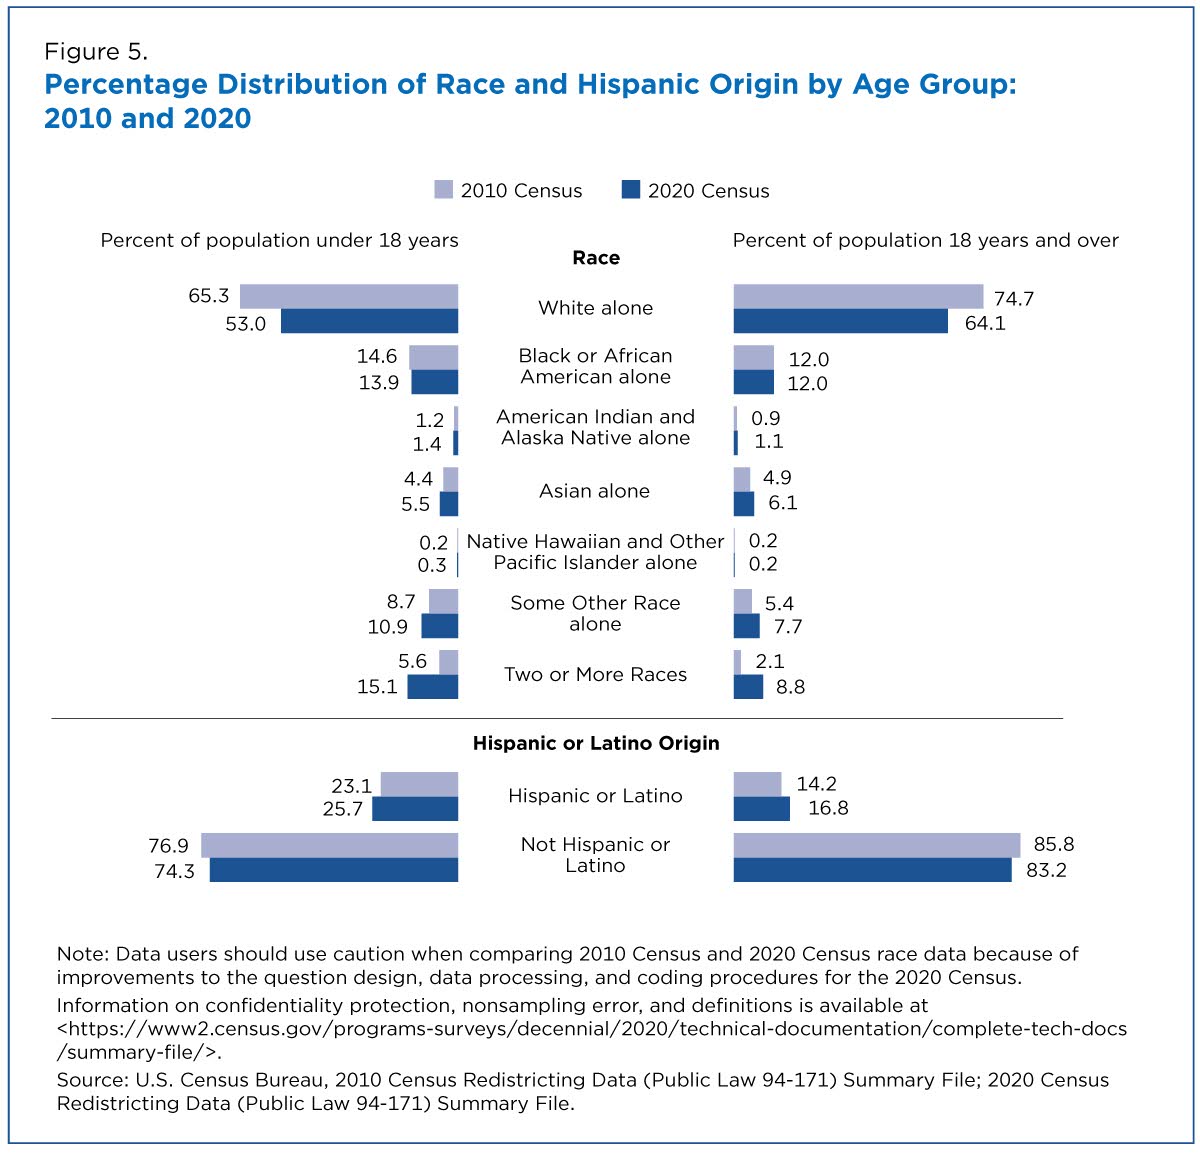
The 2020 Census data also enable us to examine the racial and ethnic composition of the population under age 18 (children) and the population age 18 and over (adults) (Figure 5).
The racial and ethnic composition among children is quite different from adults. This comparison offers insights into the demographics of younger generations in this country and glimpses of what the future may bring.
- The White alone adult population (age 18 and over) went from 74.7% in 2010 to 64.1% in 2020. In contrast, the Multiracial adult population increased from 2.1% in 2010 to 8.8% in 2020.
- In 2020, the Black or African American alone (12%), American Indian and Alaska Native alone (1.1%), and Native Hawaiian and Other Pacific Islander alone (0.2%) populations comprised similar shares of the total adult population as in 2010.
- Among children, the White alone population changed from 65.3% to 53%; the Black or African American alone population changed from 14.6% to 13.9%.
- The percentages increased for children in all other groups, especially the Some Other Race alone (8.7% in 2010; 10.9% in 2020) and Multiracial (5.6% in 2010; 15.1% in 2020) populations.
- The percentages also increased for Hispanic or Latino children from 2010 to 2020 (23.1% to 25.7%).
The observed changes in the White population, Some Other Race population, and Multiracial population could be attributed to a number of factors, including demographic change since 2010. But we expect they were largely due to the improvements to the design of the two separate questions for race and ethnicity, data processing, and coding, which enabled a more thorough and accurate depiction of how people prefer to self-identify.
Related Information
Supplemental tables related to this story are available.
For more information on how the Census Bureau collects, codes and tabulates statistics on race and Hispanic or Latino origin, explore our 2020 Census subject definitions pages and the 2020 Census Redistricting Technical Documentation.
Information on the application of differential privacy and data accuracy for the 2020 Census at various levels of geography are available on 2020 Census Data Products: Disclosure Avoidance Modernization website.****
All the authors are in the Census Bureau’s Population Division:
Nicholas Jones is director of Race and Ethnicity Research and Outreach.
Rachel Marks is chief of the Racial Statistics Branch.
Roberto Ramirez is assistant division chief for Special Population Statistics.
Merarys Ríos-Vargas is chief of the Ethnicity & Ancestry Branch.
Where this page came from
This page was imported from U.S. Census Bureau. Published by the U.S. Census Bureau and, as a work of the United States government, in the public domain; material credited to others is left out.
Nobody has written it yet — it is the source material at a new address, which is why search engines are asked to skip it and why no one earns from it. It is up for grabs: take it on, and it is yours to rewrite and to earn from.
Лицензия: CC0 1.0 (общественное достояние) · По материалам www.census.gov
1
0
0
0

Комментарии