Есть что улучшить? Предложите правку.
Woody vegetation, including ashe juniper (Juniperus ashei), has encroached on some areas in central Texas that were historically oak grassland savannah (Bray, 1904). Encroachment of woody vegetation is generally attributed to overgrazing and fire suppression (Bray, 1904; Van Auken, 2000). Removing the ashe juniper and allowing native grasses to reestablish in the area as a brush management conservation practice (hereinafter referred to as “brush management”) might change the hydrology in the watershed (Thurow and Hester, 1997; Tennesen, 2008). These hydrologic changes might include changes to surface-water runoff, evapotranspiration, or groundwater recharge.
The idea of hydrologic changes resulting from brush management generally is based on a simplified mass balance approach to the hydrologic cycle in which rainfall accounts for the water coming into the system and rainfall is distributed to surface-water runoff (streamflow), evapotranspiration (combination of evaporation and transpiration), or groundwater recharge (subsurface flow that contributes to the groundwater table or contributes to spring discharge downstream from the study area) (Zhang and others, 2002). If the amount of rainfall remains constant and the evapotranspiration rates change because of a change in vegetation cover, then the surface-water or groundwater components of the hydrologic budget will change.
The U.S. Geological Survey (USGS), in cooperation with Federal, State, and local partners, examined the hydrologic effects of brush management in two adjacent watersheds (figs. 1 and 2). Hydrologic data were collected in the watersheds for 3–4 years (pre-treatment) depending on the type of data, after which brush management occurred on one watershed (treatment watershed) and the other was left in its original condition (reference watershed). Hydrologic data were collected in the study area for another 6 years (post-treatment). These hydrologic data included rainfall, streamflow (fig. 3), evapotranspiration (fig. 1), and water quality. Groundwater recharge was not directly measured, but potential groundwater recharge was calculated by using a simplified mass balance approach.

Figure 1. Evapotranspiration station in the treatment watershed at site TWSET (U.S. Geological Survey station 295102098283200 Honey Creek treatment evapotranspiration near Spring Branch, Texas), Honey Creek State Natural Area, Comal County, Tex., July 23, 2010.
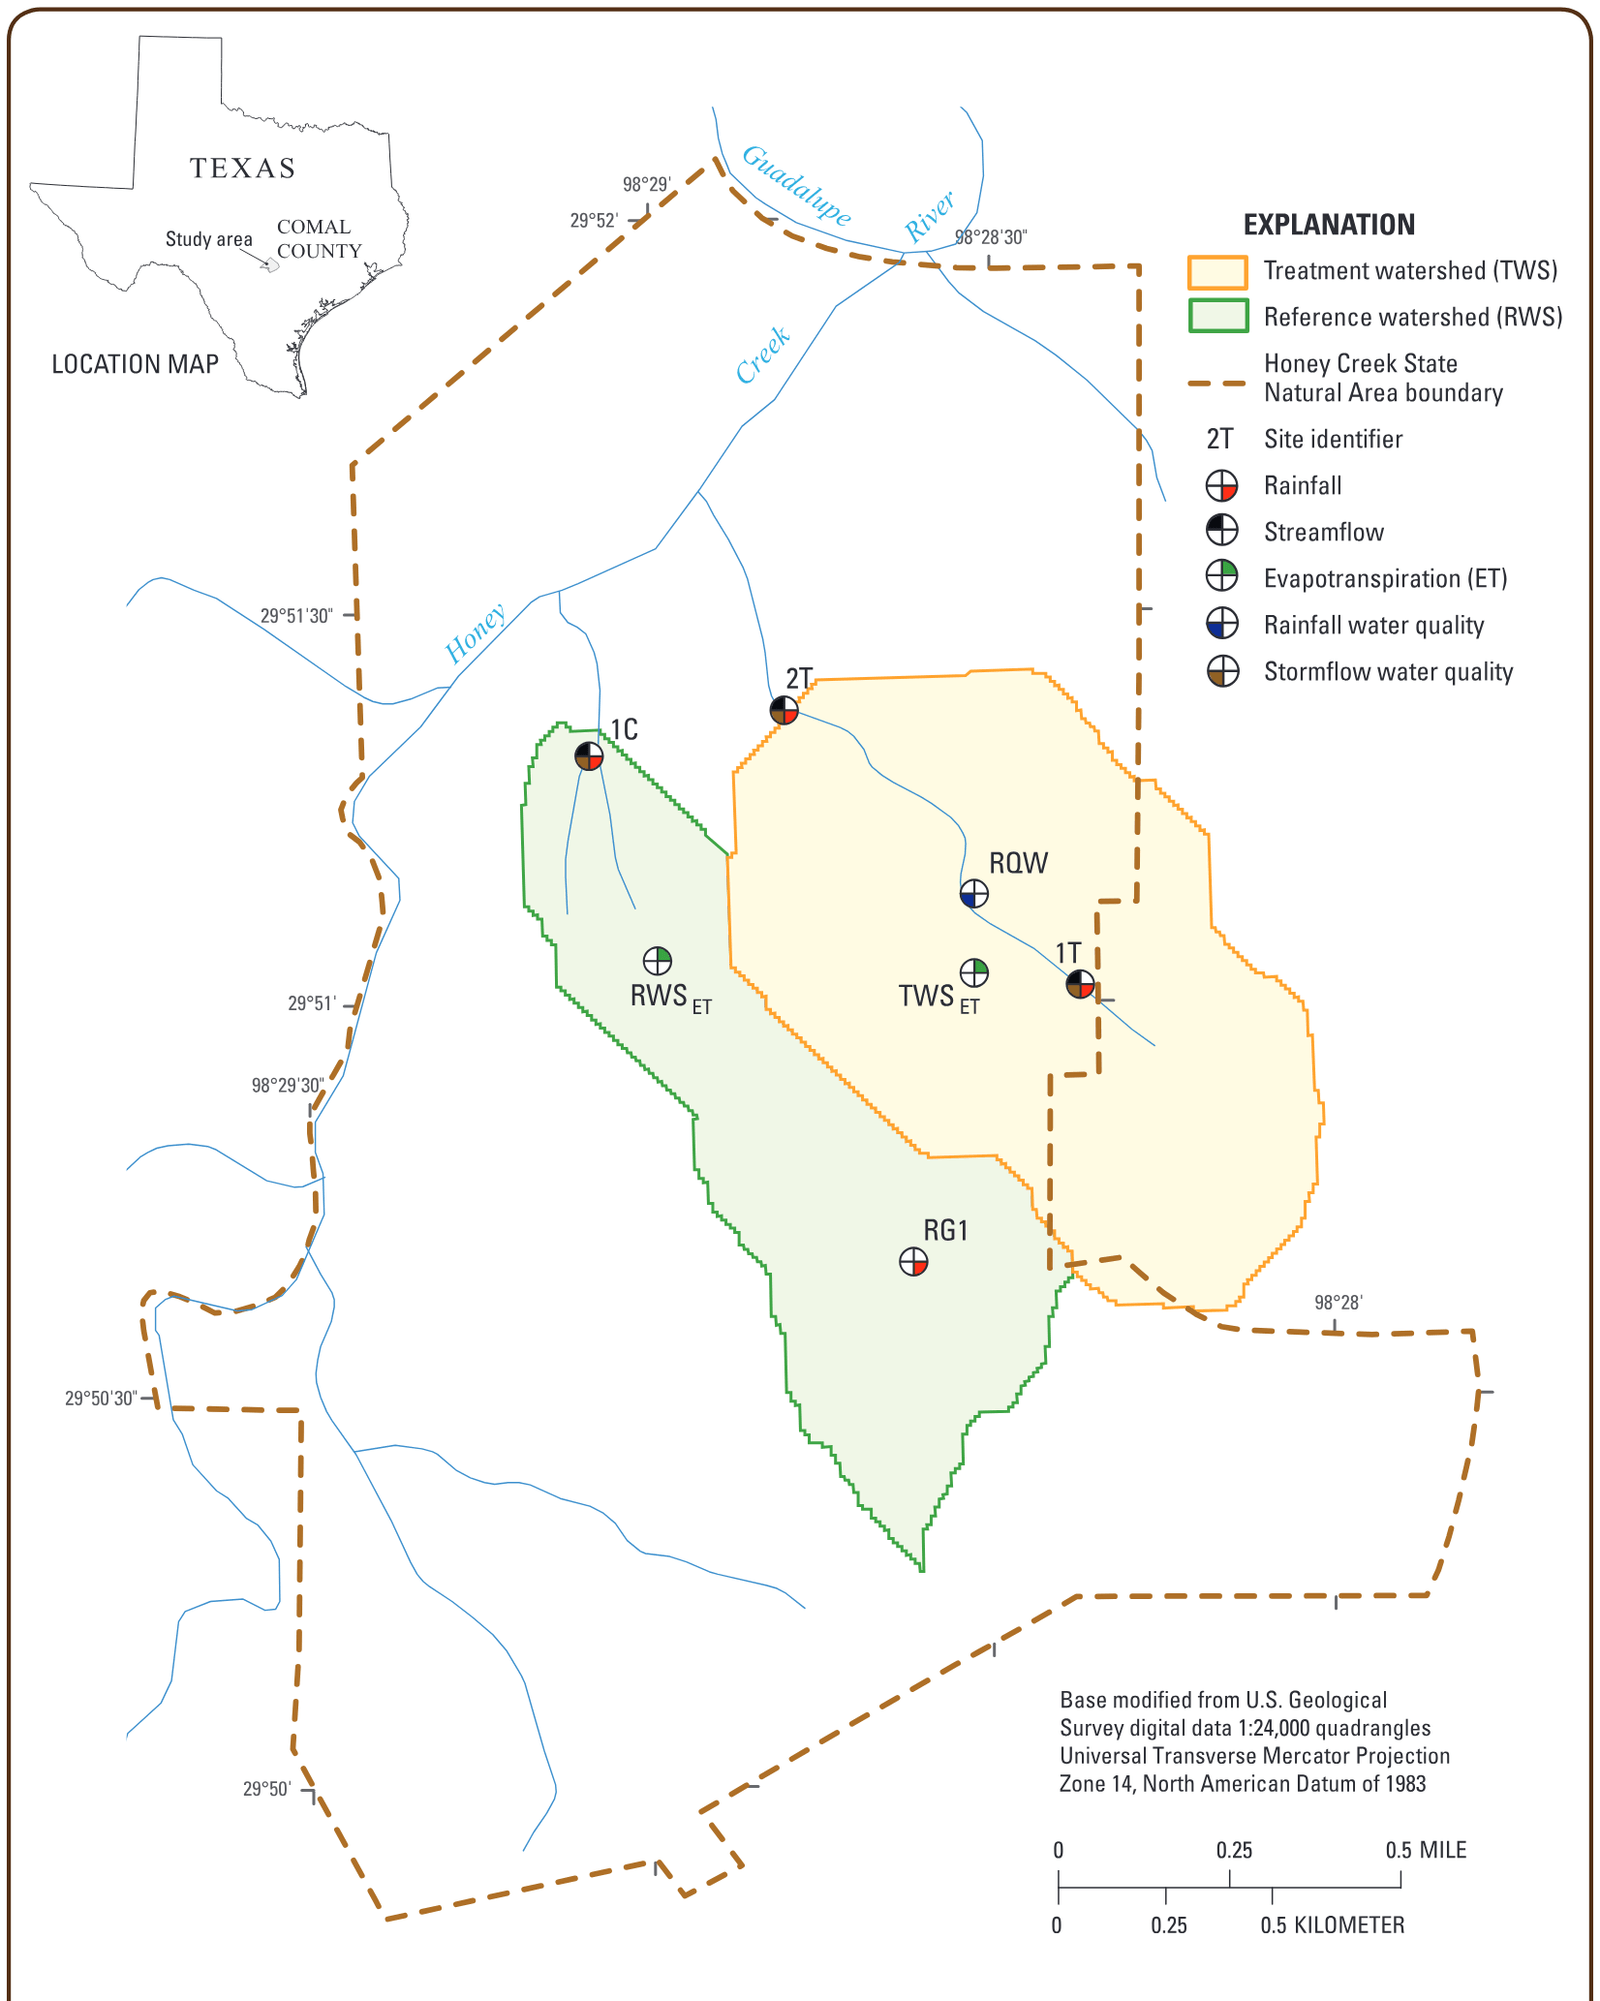
Figure 2. Locations of data-collection sites in the Honey Creek State Natural Area, Comal County, Texas.

Figure 3. Streamflow-gaging stations were installed in the study area, such as this weir in the treatment watershed at site 2T (U.S. Geological Survey station 08167353 Unnamed tributary of Honey Creek site 2T near Spring Branch, Texas), Honey Creek State Natural Area, Comal County, Tex.
The following highlights of the study are summarized from the USGS Scientific Investigations Report (Banta and Slattery, 2011) on which this fact sheet is based:
- The streamflow to rainfall relation (expressed as event unit runoff to event rainfall relation) did not change between the watersheds during pre- and post-treatment periods.
- Daily evapotranspiration rates at the reference watershed site RWSET (USGS station 295104098285900 Honey Creek reference evapotranspiration near Spring Branch, Tex.; fig. 2) and the treatment watershed site TWSET (USGS station 295102098283200 Honey Creek treatment evapotranspiration near Spring Branch, Tex.; fig. 2) exhibited a seasonal cycle during the pre- and post-treatment periods, with intraannual and interannual variability (fig. 4). Statistical analyses indicate that the mean difference in daily evapotranspiration rates between the two sites (RWSET - TWSET) is greater during the post-treatment period than it was during the pre-treatment period.
- Average annual rainfall, streamflow, evapotranspiration, and potential groundwater-recharge conditions were incorporated into a hydrologic budget (expressed as a percentage of the average annual rainfall) for each watershed pre- and post-treatment to evaluate the effects of brush management. The percent average annual unit runoff in the reference watershed was similar to that in the treatment watershed during both the pre- and post-treatment periods. In contrast, the difference in percentages of average annual evapotranspiration and potential groundwater recharge during the post-treatment period were more appreciable between the reference and treatment watersheds than during the pre-treatment period.
- Graphical comparisons indicated that there were no notable differences in major ion or nutrient concentrations between samples collected at the reference watershed site 1C (USGS station 08167347 Unnamed tributary of Honey Creek site 1C near Spring Branch, Tex.; fig. 2) and the treatment watershed site 2T (USGS station 08167353 Unnamed tributary of Honey Creek site 2T near Spring Branch, Tex.; fig. 1) during pre- and post-treatment periods.
- The relation between suspended-sediment loads and streamflow calculated from samples collected from sites 1C (in the reference watershed) and 2T (in the treatment watershed) did not exhibit a statistically significant difference during the pre-treatment period, whereas during the post-treatment period, the relation between suspended-sediment loads and streamflow did exhibit a statistically significant difference. The relations of suspended-sediment load to streamflow indicate that, for the same streamflow, the suspended-sediment loads calculated from site 2T were generally less than the suspended-sediment loads calculated from site 1C during the post-treatment period.

Figure 4. Daily evapotranspiration data at A, the reference watershed evapotranspiration site RWSET (U.S. Geological Survey station 295104098285900 Honey Creek reference evapotranspiration near Spring Branch, Texas) and B, the treatment watershed evapotranspiration site TWSET (U.S. Geological Survey station 295102098283200 Honey Creek treatment evapotranspiration near Spring Branch, Tex.). C, The difference in evapotranspiration between the sites (RWSET - TWSET), along with weekly total rainfall in the study area.
Where this page came from
This page was imported from U.S. Geological Survey. Published by the U.S. Geological Survey and, as a work of the United States government, in the public domain.
Nobody has written it yet — it is the source material at a new address, which is why search engines are asked to skip it and why no one earns from it. It is up for grabs: take it on, and it is yours to rewrite and to earn from.
Лицензия: CC0 1.0 (общественное достояние) · По материалам pubs.usgs.gov
1
0
0
0

Комментарии