Есть что улучшить? Предложите правку.
I’m standing with Jerry Seeber in Tampa Bay Water’s surface water treatment plant. Around us, a series of pipes, spouts, funnels, and tanks gurgle, trickle, and drain, shuttling some of the 250 million gallons of water a day from the area’s rivers and reservoir to people’s taps.
Jerry Seeber is the operations manager at Tampa Bay Water.
It’s a strange backdrop for a geography lesson, but that’s exactly what’s happening. Seeber looks like a wizard casting a spell as his thick index finger traces an invisible line across an imaginary map. The line starts in the Sonoran Desert, which straddles the Arizona-Mexico border, and races due east across nearly 7,500 miles until it hits Cairo, Egypt, on the far edge of the Sahara.
“Tampa Bay sits right on that line,” Seeber explains. In case the lesson isn’t clear, Seeber continues: “If Florida weren’t a peninsula, this place would be a desert.”
He’s right. Surrounded by ocean moisture, Florida is an oasis sitting right in the middle of the desert belt, which traverses the subtropical latitudes north and south of the equator. But even oases sometimes go dry.
Surrounded by ocean, Florida is an oasis in the Northern Hemisphere “desert belt.” Located between the tropics and the mid-latitudes, the sub-tropical desert belt occurs where, on average, air is sinking from high altitudes back toward the surface. As air sinks, it tends to warm, and moisture evaporates. Map by NOAA climate.gov team, based on NASA Blue Marble data.
In the 1980s and 1990s, a dramatic population boom and a reliance solely on groundwater tested the limits of the oasis. Learning from those lessons, Tampa Bay Water has spent the past 20 years diversifying their water supply to include surface and desalinated seawater.
The diversification was necessary, but it posed new risks: surface water supplies are vulnerable to seasonal climate shifts. Tampa Bay Water has been a leader in the region for figuring out how to use seasonal forecasts to reduce their vulnerability during dry years and to maximize the benefit of the wet years.
The future might provide even more challenges for the water provider, though. Without innovative thinking and planning, the limits of the oasis might again be tested by further population growth and climate change.
The Past
It’s 1990. The Tampa Bay metropolitan population has doubled to 2 million in the past 20 years. The area relies almost entirely on groundwater for the 250 million gallons a day it takes to meet the Tampa Bay metro area’s demands. Last year, a drought started, and it will last for the next four years.
The onset of drought coupled with explosive population growth and urban development that continue in the coming decade means that water is being pumped out of the aquifer more quickly than nature can put it back in.
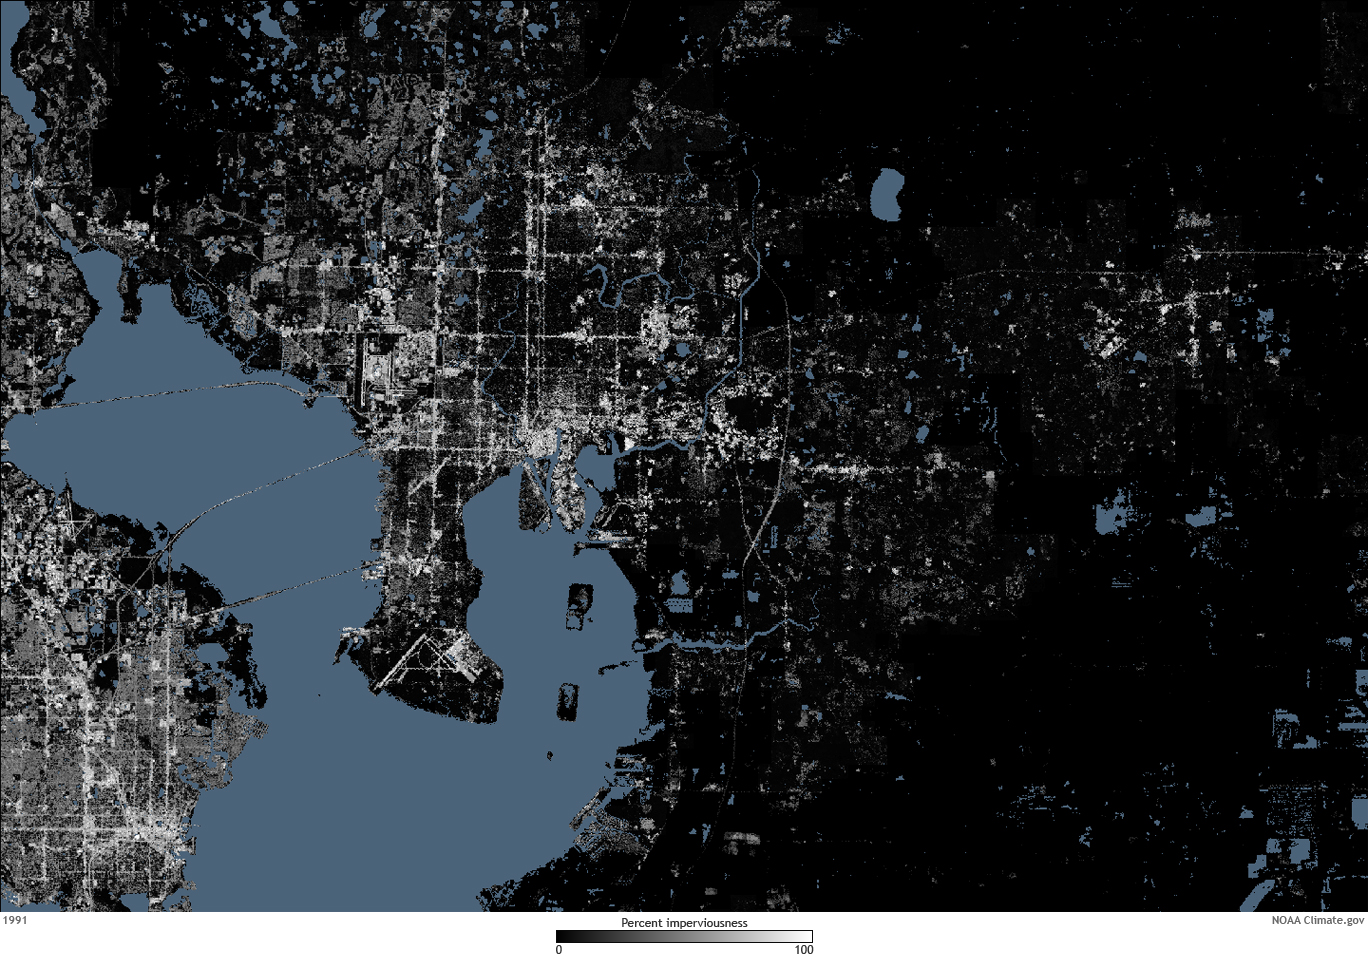
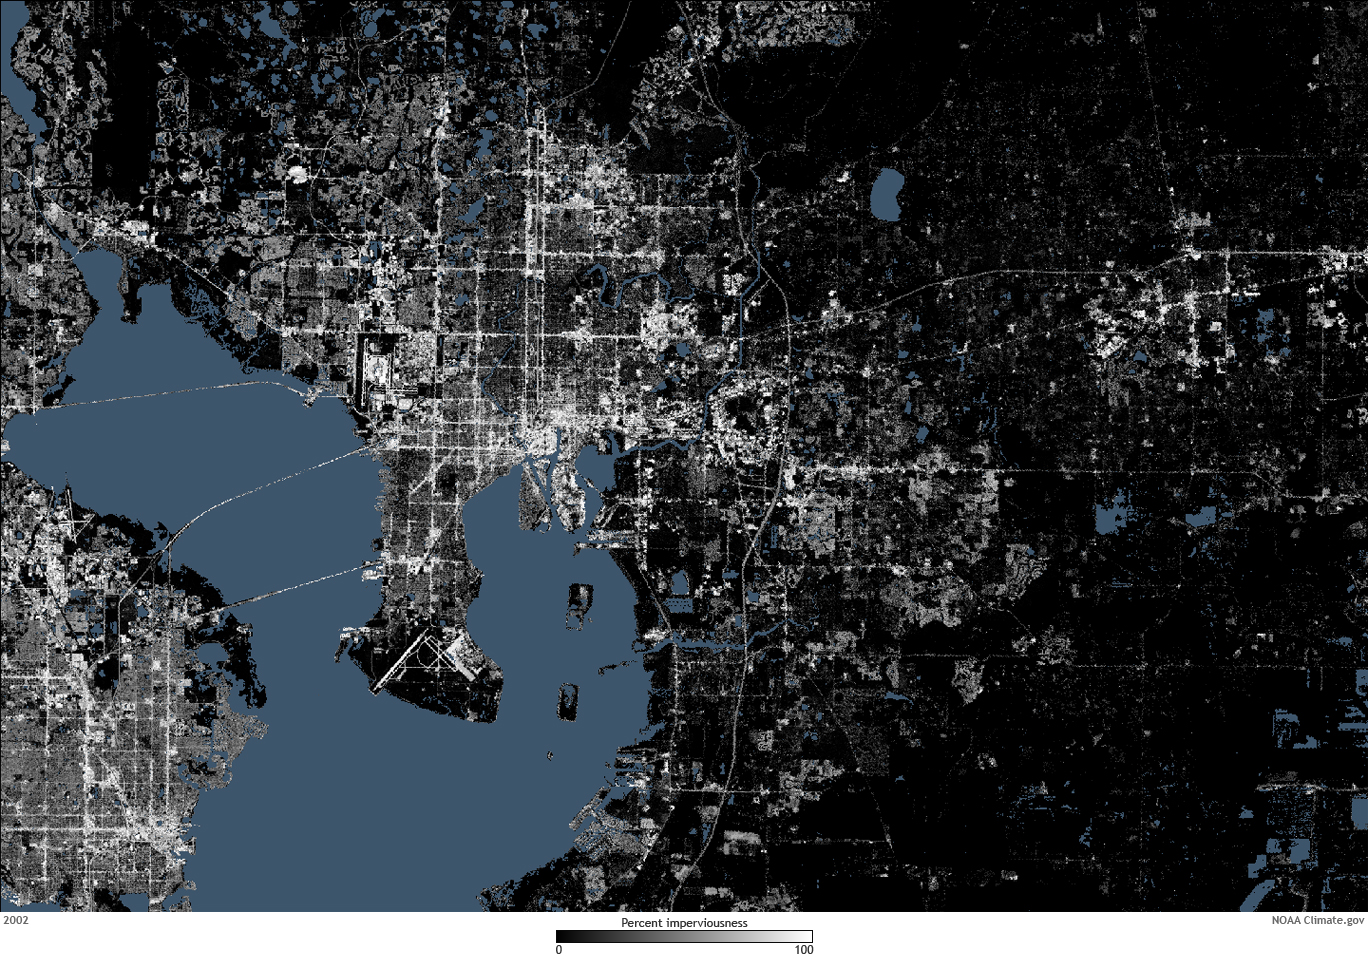
Satellite maps of the percent of “impervious surface”—roads, parking lots, and other areas that water can’t seep through—document Tampa’s growth in just one decade (1991, at left; 2002, right). Tampa itself gets more “built up,” and significant increases in impervious surfaces are obvious in the northwest and southeast metro areas. Maps by NOAA Climate.gov team based on data from the U.S. Geological Survey. Large images: 1991 | 2002
The result is massive environmental degradation. Wetlands and lakes have disappeared, drained from the bottom up. As the water table sinks lower and lower, land has subsided. Sinkholes have toppled trees and cracked house foundations.
The Present
Tampa Bay Water was born out of the previous decades’ catastrophe and charged with finding a way to make sure there was enough water for “everything from fighting fires to washing babies,” as Seeber likes to say, while also restoring the wetlands, rivers, and lakes that are a fundamental reason why so many people live in and visit Florida.
To avoid a repeat environmental disaster, Tampa Bay Water had to diversify its water sources. The agency built a reservoir, which opened in 2005, and then a desalination plant, which went operational in 2007. Along with a new state-of-the-art water treatment plant that can treat water directly from area rivers, the new options reduced their reliance on groundwater and gave wetlands space and time to recover.
But diversifying their water sources also opened up Tampa Bay Water’s operations to new challenges. “We’ve developed these alternative supplies, but now we’re more dependent on Mother Nature,” Seeber said. “We’ve got to pay a lot more attention to weather.”
Paying attention to the weather and the climate is part of Alison Adams’ responsibilities as Tampa Bay Water’s source rotation and environmental protection manager. After the geography lesson with Seeber at the treatment plant, I meet Adams at her office. A computer, books, and printouts of climate forecasts replace the pipes, tanks, and funnels.
Alison Adams is the source rotation and environmental protection manager for Tampa Bay Water.
Adams’ short white hair wisps across her forehead, drawing you straight into her piercing eyes. She speaks with a slight hint of a Southern accent, perhaps a remnant from her years of growing up on a Florida farm. That upbringing spurred her interest in the natural environment, particularly water.
Alison Adams is the source rotation and environmental protection manager for Tampa Bay Water. (Photo by Brian Kahn.)
Her wiry frame gives her away as a runner. When I first spoke with her in February 2012, she was in the process of training for a double marathon in Wyoming in May. If the thought of running a 26.2-mile marathon seems grueling, a 52.4-mile double marathon seems downright masochistic. For Adams, this is what constitutes relaxing.
Adams also pushes the limits of water management. “Unique,” “forward-thinking,” and “innovative” are a few of the words Adams’ colleagues use to describe her approach to water management.
Alison Adams talks about the rewards of bringing climate scientists and water managers together to improve how the Tampa metro area uses water.
Under her guidance, Tampa Bay Water was invited to participate in the Water Utility Climate Alliance, a group of the eight largest water utilities in the West, plus New York City. Tampa Bay Water received the invitation because of its adaptive management approach to the sort of seasonal variability issues that western utilities commonly have to cope with.
Climate, Costs, and Permits
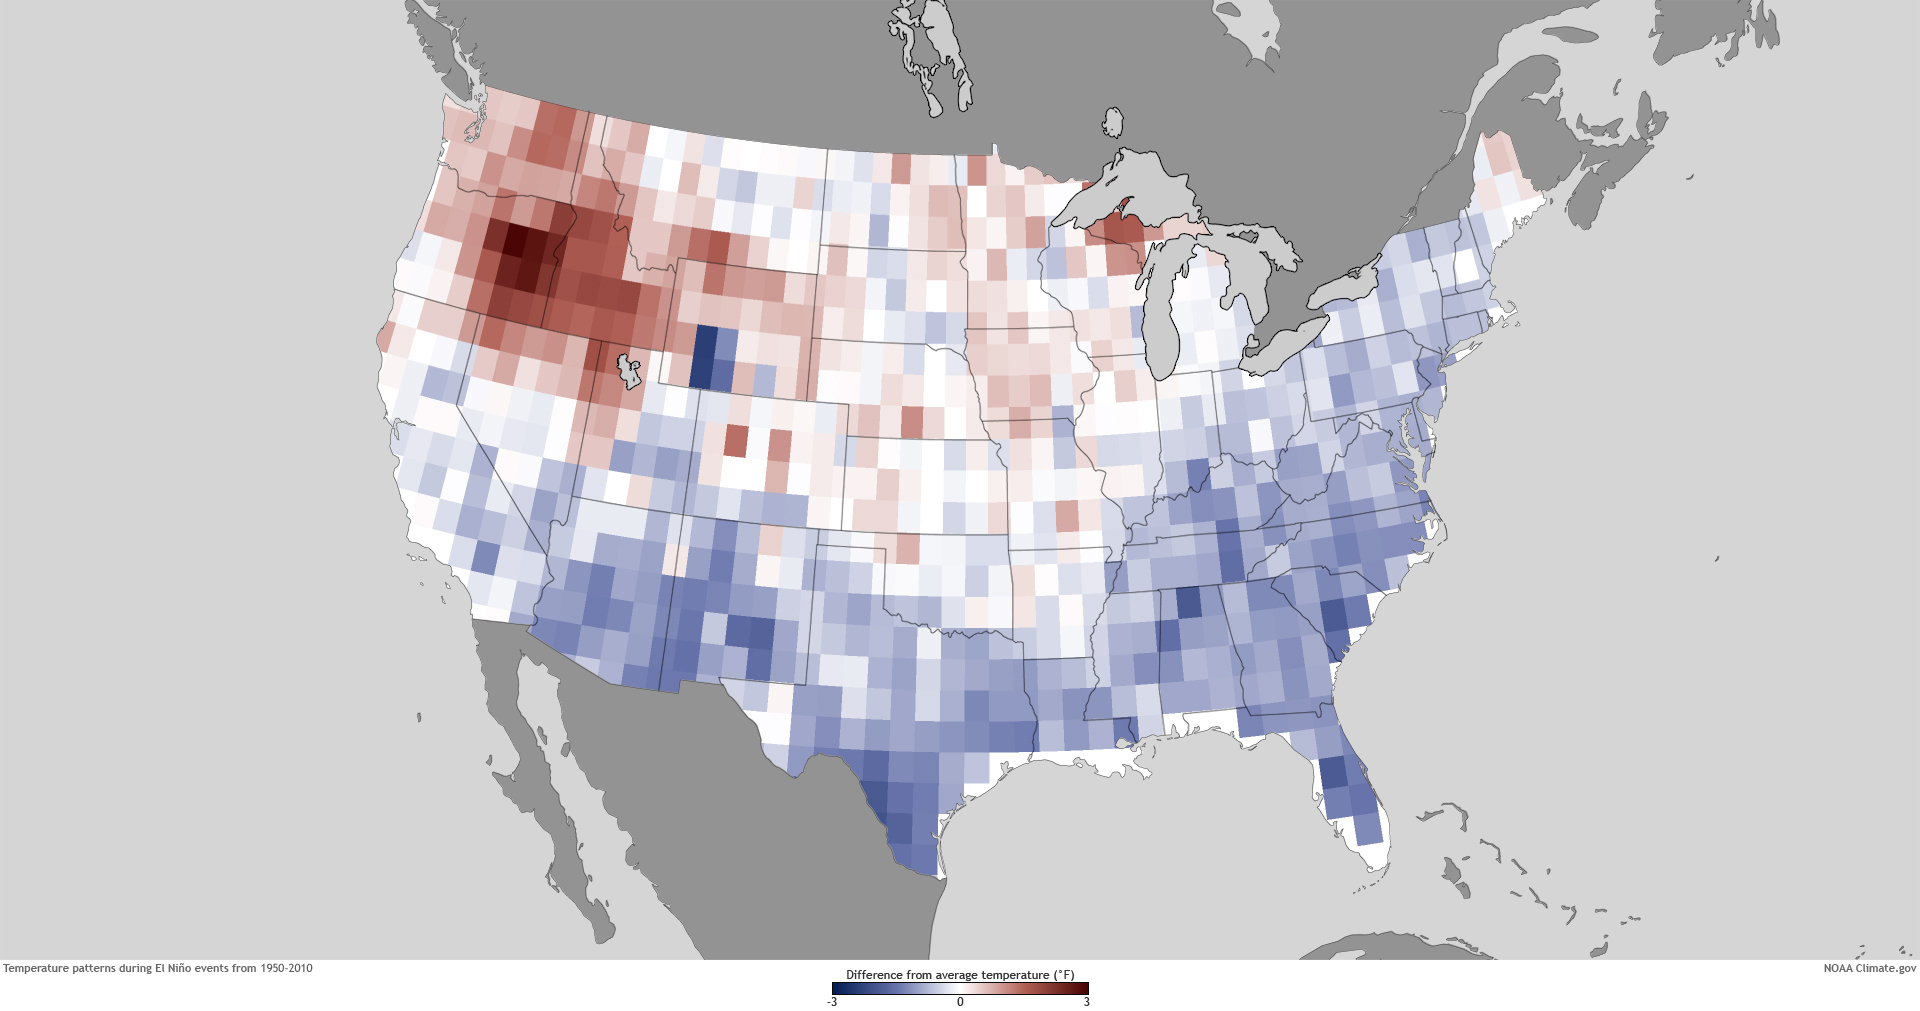
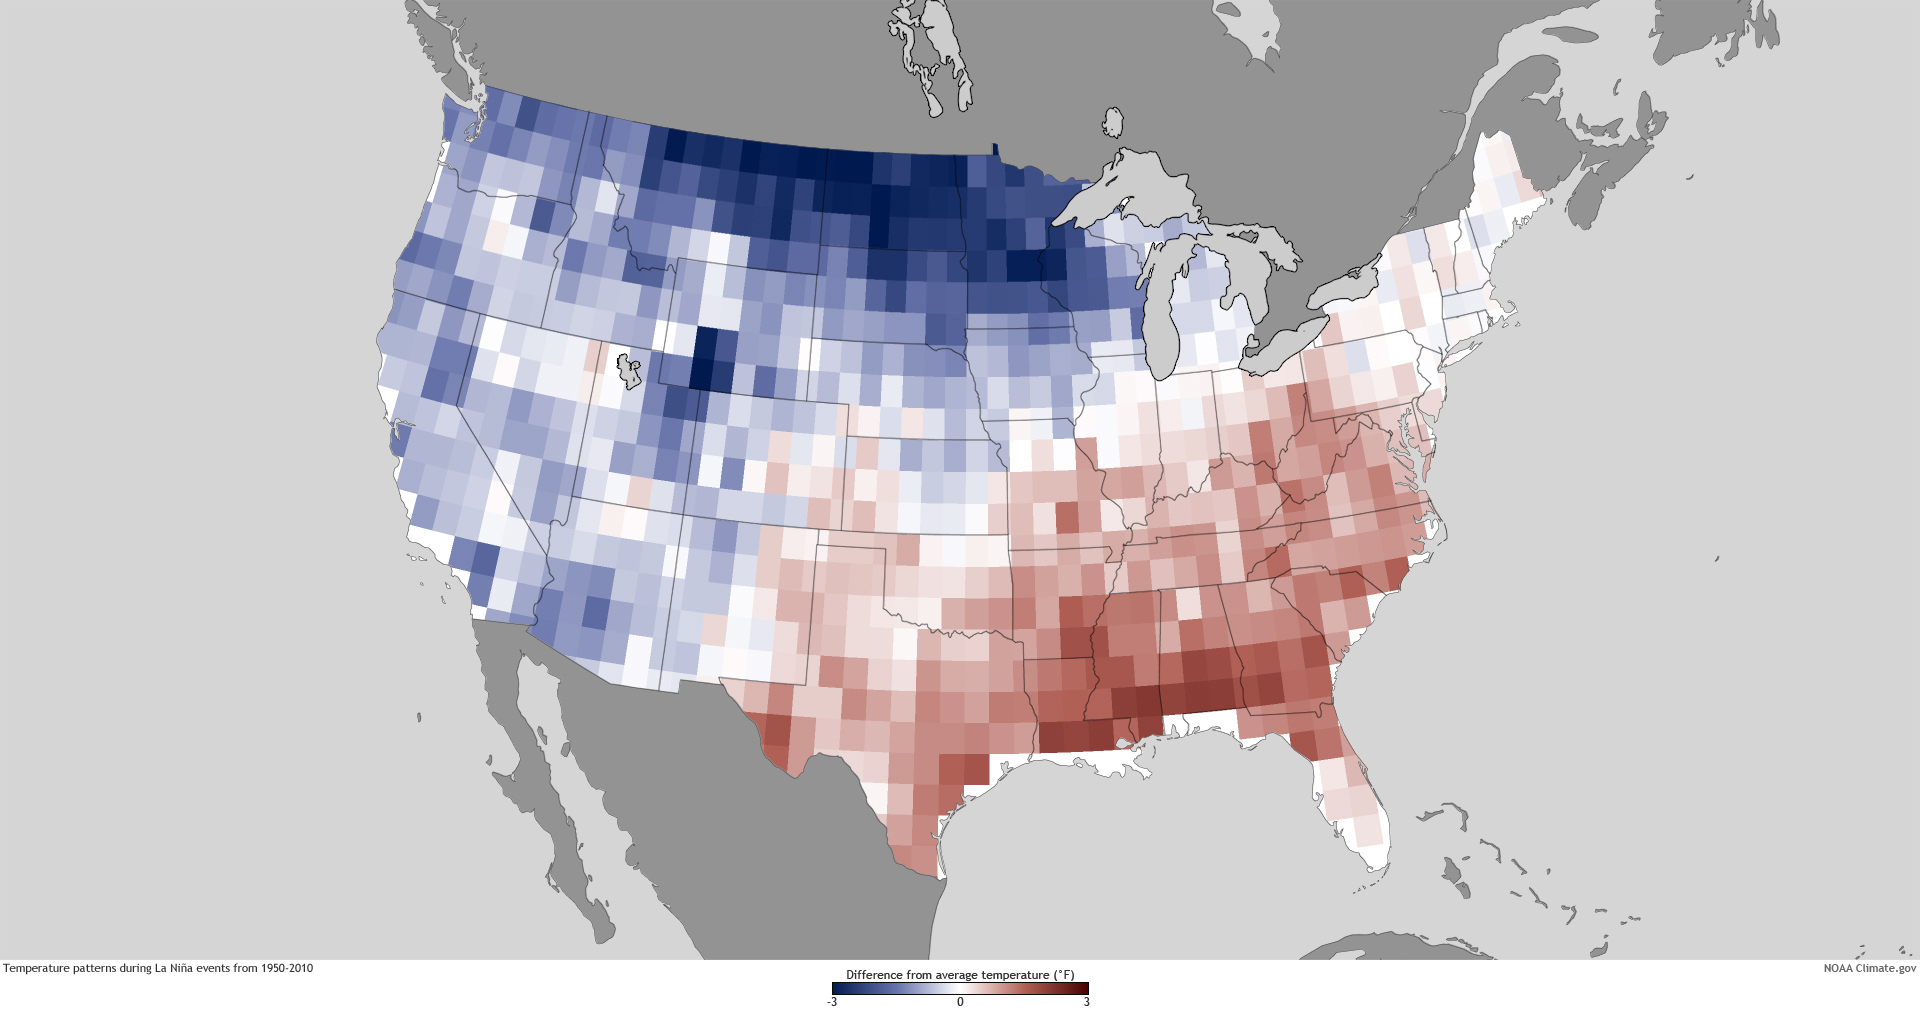
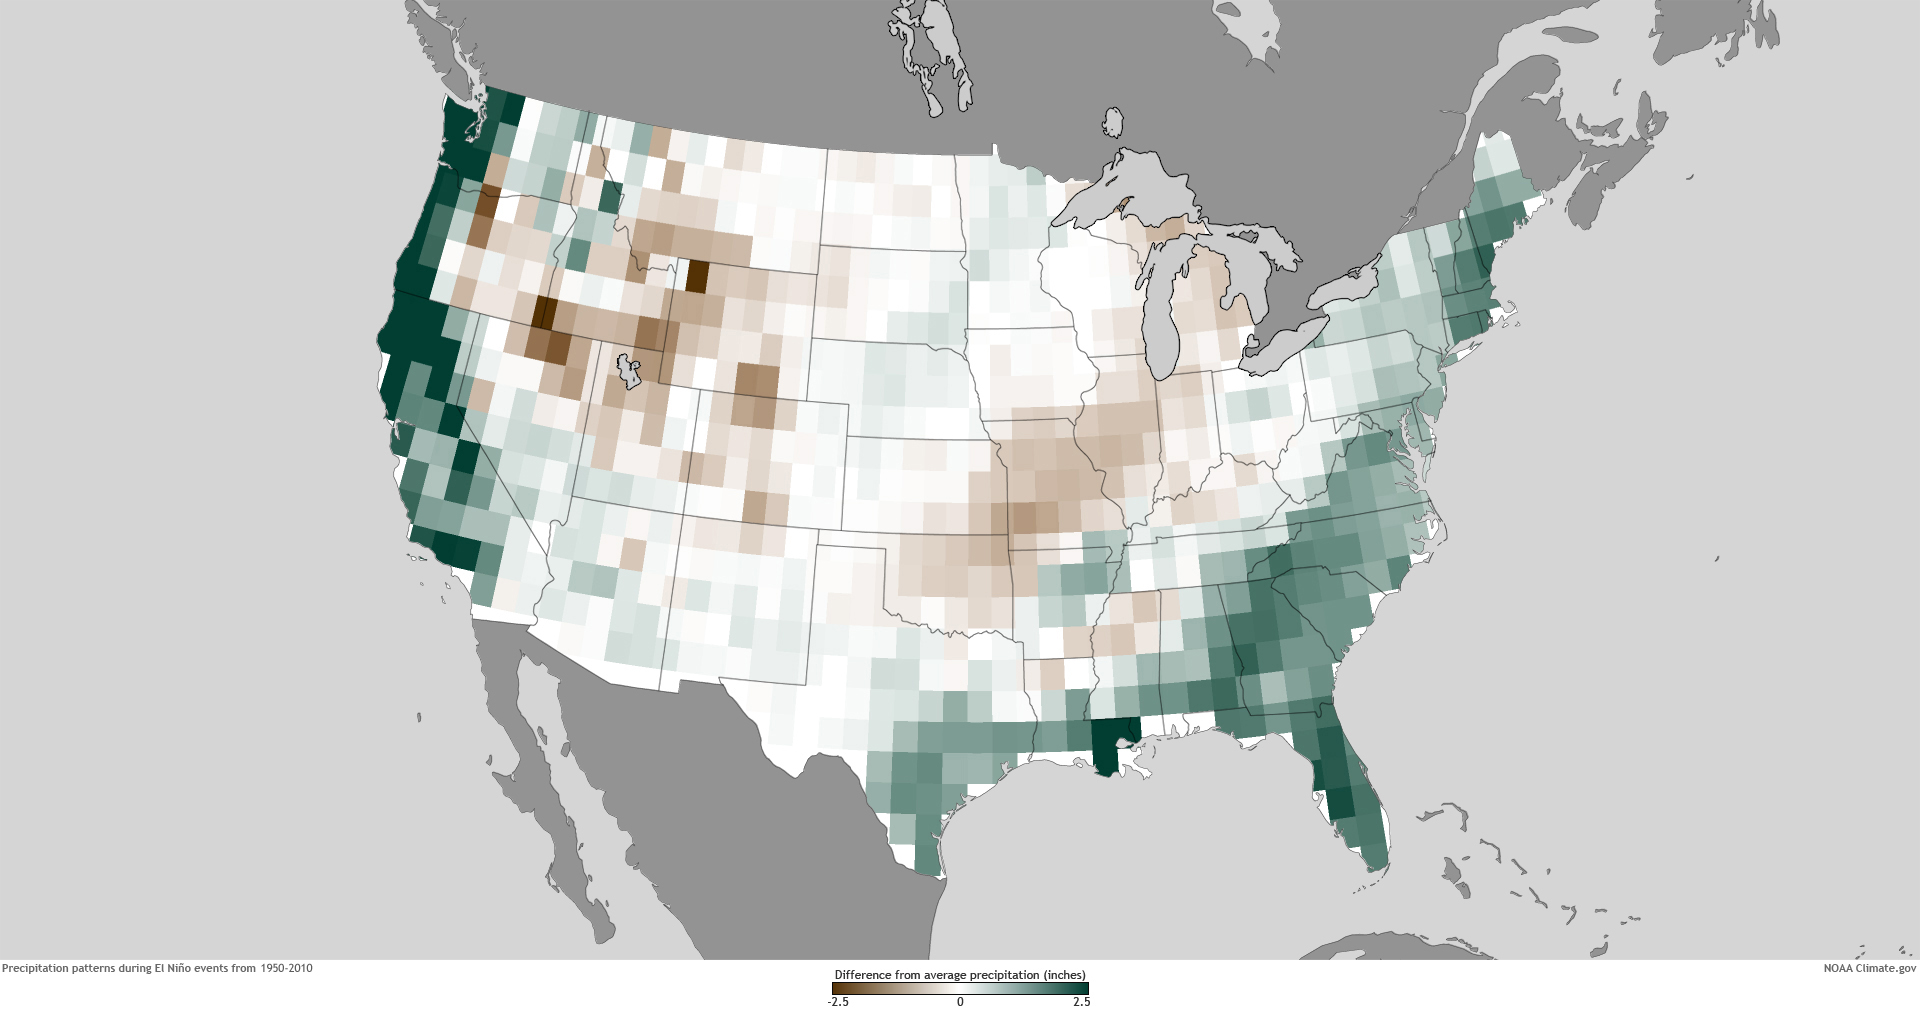
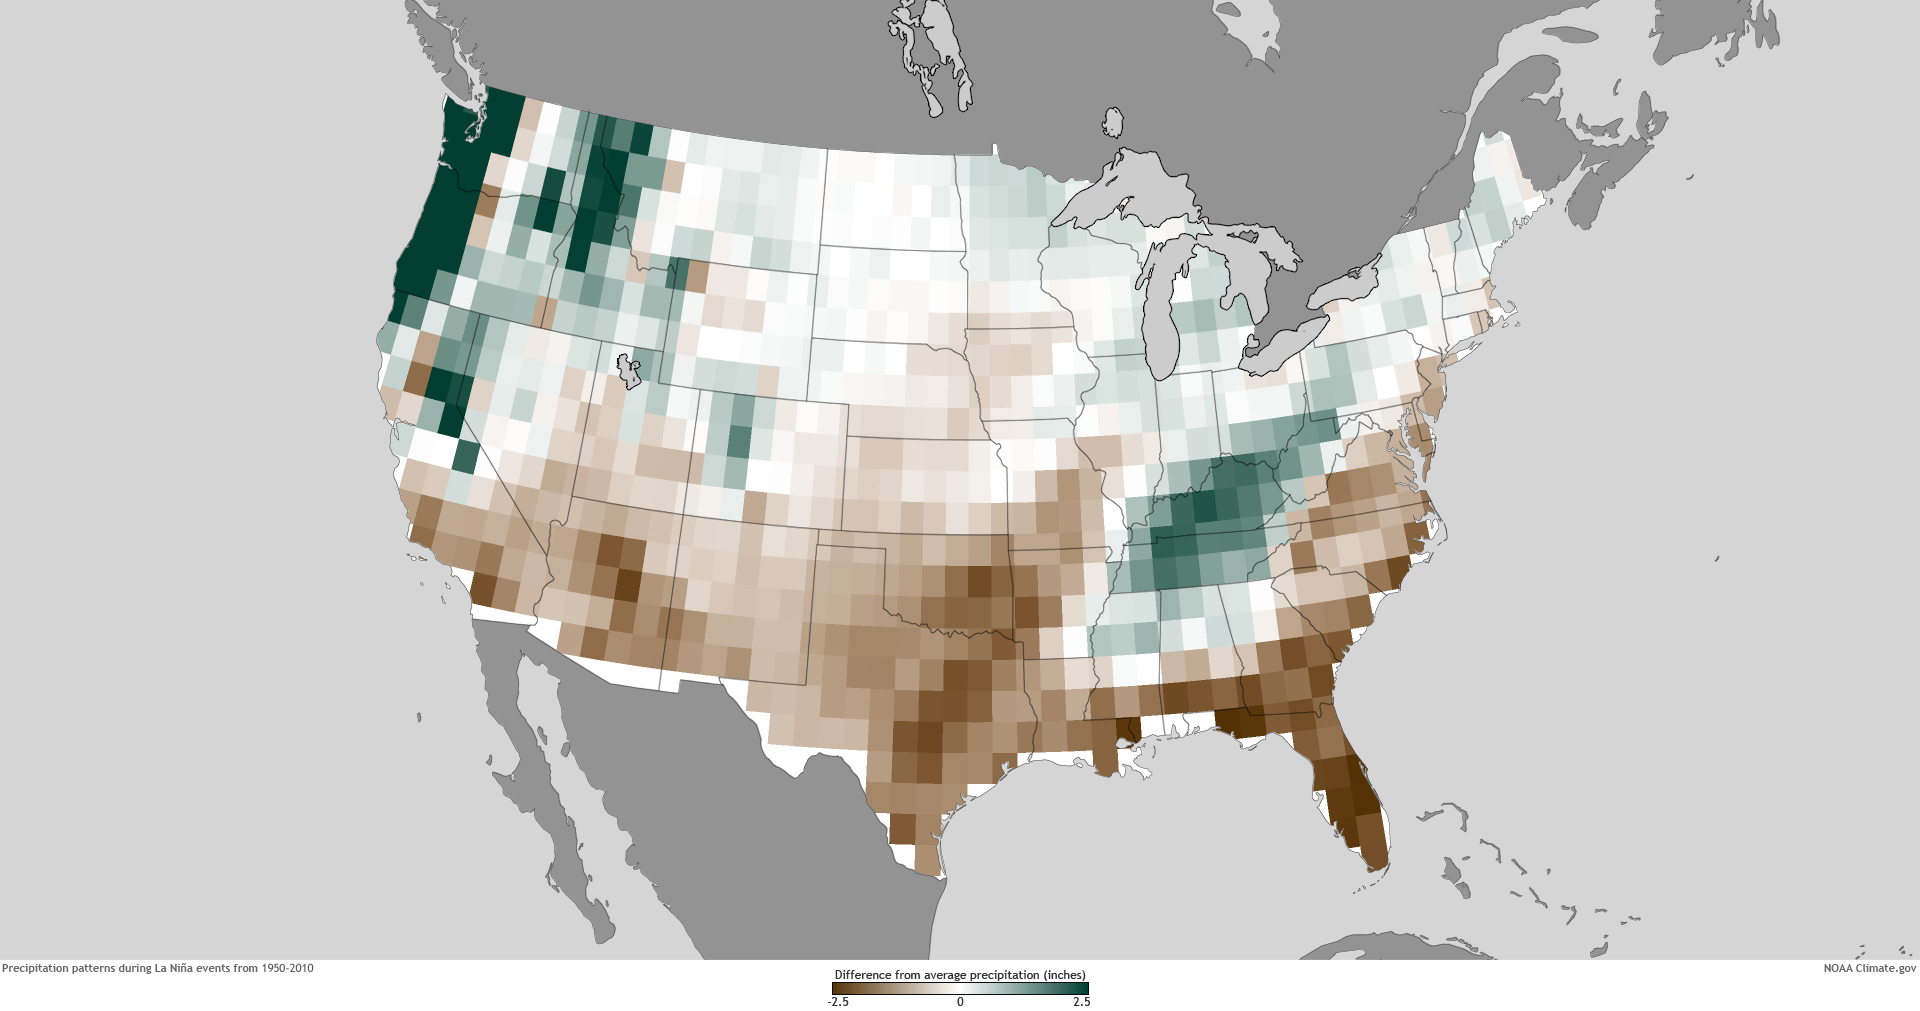
At the top of the list of climate patterns that Florida must cope with are El Niño and its opposite, La Niña. The seesawing warm and cool ocean temperatures in the tropical Pacific are particularly influential in winter. Winter is smack in the middle of Florida’s dry season, which starts in November and runs through March. El Niño increases the likelihood of a colder- and wetter-than-normal dry season, while La Niña tends to lead to a warmer and drier season.
Maps of the difference from average December-February temperature (top row) and precipitation (bottom) during the 22 El Niño and 19 La Niña episodes in the past 60 years. (Maps by NOAA climate.gov team, based on data provided by Michelle L’Heureux, NOAA Climate Prediction Center.) large temperate maps: El Niño | La Niña large precipitation maps: El Niño | La Niña
For a water manager like Adams, the connection between Florida’s climate and El Niño and La Niña is both a curse and a blessing. On the one hand, having a La Niña occur every 2-5 years means she has to deal with drought and water shortages that generally accompany it. On the other hand, El Niño and La Niña are fairly predictable a few months ahead of time. That means Adams can plan ahead for capturing the excess water in the wetter years and being more mindful of storing it in the drier ones.
Of course it’s not as easy as flipping a switch in a given year. Climate forecasts come with a degree of confidence (ENSO increases the likelihood of certain conditions) not a guarantee. For example, there was a La Niña in winter 2010. While the region did, in fact, see decreased rainfall, temperatures were unexpectedly cooler than normal due to other climate factors.
Underscoring everything is the matter of cost. Processing water through the desalination plant can cost around $5 per 1,000 gallons. Those same 1,000 gallons only cost about $2 to treat and deliver when they are drawn from rivers and processed at the surface water treatment plant. When you start talking about processing tens of millions of gallons of water each day, the price differences can add up pretty quickly.
This drawing shows all the steps involved in making seawater from Tampa Bay into drinkable tap water. Drawing provided by www.tampabaywater.org.
Making up for dry years with more groundwater pumping also carries a risk. The state regulatory authority has set a limit for Tampa Bay Water allowing them to pump 90 million gallons per day over a 12-month running average from 11 of its regional well fields.
Tampa Bay Water can request an emergency order to pump beyond the permits, but only if all other supplies are exhausted. And their requests aren’t always granted.
A case in point was the spring of 2009. Tampa Bay Water went over its groundwater pumping limit during a drought. The state regulatory authority denied their emergency request, however, and instead fined them roughly $46,000. Ultimately, good rainfall in the latter half of the year put Tampa Bay Water back in compliance.
Connecting Climate to Consumption
Where this page came from
This page was imported from NOAA Climate.gov. Published by NOAA Climate.gov, which lets anything credited to it be re-used with attribution; material credited to others is left out.
Nobody has written it yet — it is the source material at a new address, which is why search engines are asked to skip it and why no one earns from it. It is up for grabs: take it on, and it is yours to rewrite and to earn from.
Лицензия: CC0 1.0 (общественное достояние) · По материалам www.climate.gov
1
0
0
0

Комментарии