Ser du något att förbättra? Föreslå en ändring.
Related Materials

[JPG - 284 KB]](https://www.cdc.gov/mmwr/volumes/69/wr/social-media/mm695152a8_COVID19StatsIncidenceByAgeGroup_IMAGE_01Jan21_1200x675.jpg)

Click here to see a simplified version of this graph for use on social media.
Abbreviation: COVID-19 = coronavirus disease 2019.
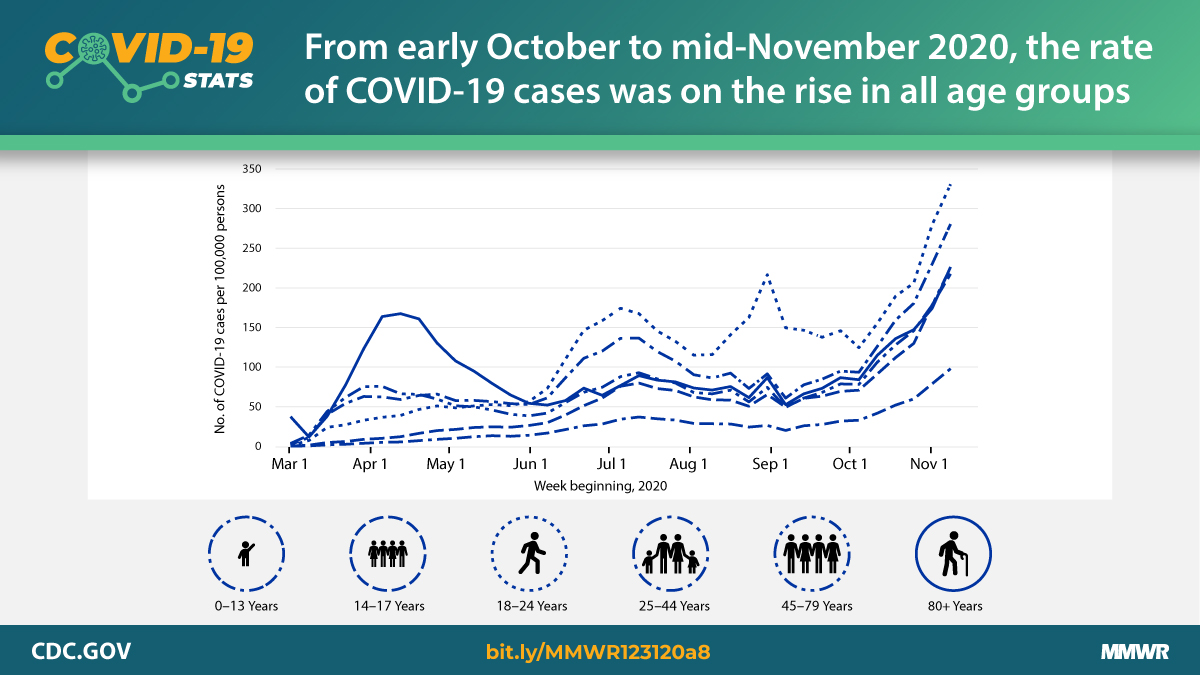
- Incidence = cases per 100,000 calculated using 2019 U.S. Census population.
† Age data for COVID-19 cases are based on case report forms submitted by state and territorial jurisdictions for confirmed and probable cases. Reporting for some jurisdictions is incomplete. Age is missing for 1% of case reports.
§ Data are provisional and subject to change.
During late March–late May, COVID-19 incidence was highest among adults aged ≥80 years, with a peak in incidence in the week beginning April 12. In June, incidence increased in all age groups, with the most rapid rate of increase and highest overall incidence among young adults aged 18–24 years; the rate in this group continues to be the highest among all age groups. Incidence steadily increased among children and adolescents (aged 0–17 years). The incidence in high school–aged persons (aged 14–17 years) was markedly higher than that in younger children by early July, then decreased before increasing in September. During late September–early October, weekly incidence decreased among young adults aged 18–24 years only, then continued to steadily increase among all age groups through November 14.
Source: CDC COVID-19 case-level report forms, March 1–November 14, 2020.
Reported by: Lindsey M. Duca, PhD, eocevent331@cdc.gov; Likang Xu, MD; Sandy F. Price; Catherine A. McLean, MD.
Where this page came from
This page was imported from Centers for Disease Control and Prevention. Material produced by the Centers for Disease Control and Prevention is a work of the United States government and is in the public domain.
Nobody has written it yet — it is the source material at a new address, which is why search engines are asked to skip it and why no one earns from it. It is up for grabs: take it on, and it is yours to rewrite and to earn from.
Licens: CC0 1.0 (allmän egendom) · Bearbetat efter www.cdc.gov
1
0
0
0

Kommentarer