Ser du något att förbättra? Föreslå en ändring.
Get tips and tricks on how to access, visualize and use Census Bureau data. The Census Academy team of data experts these Data Gems.
Growth Highest in Metro Areas
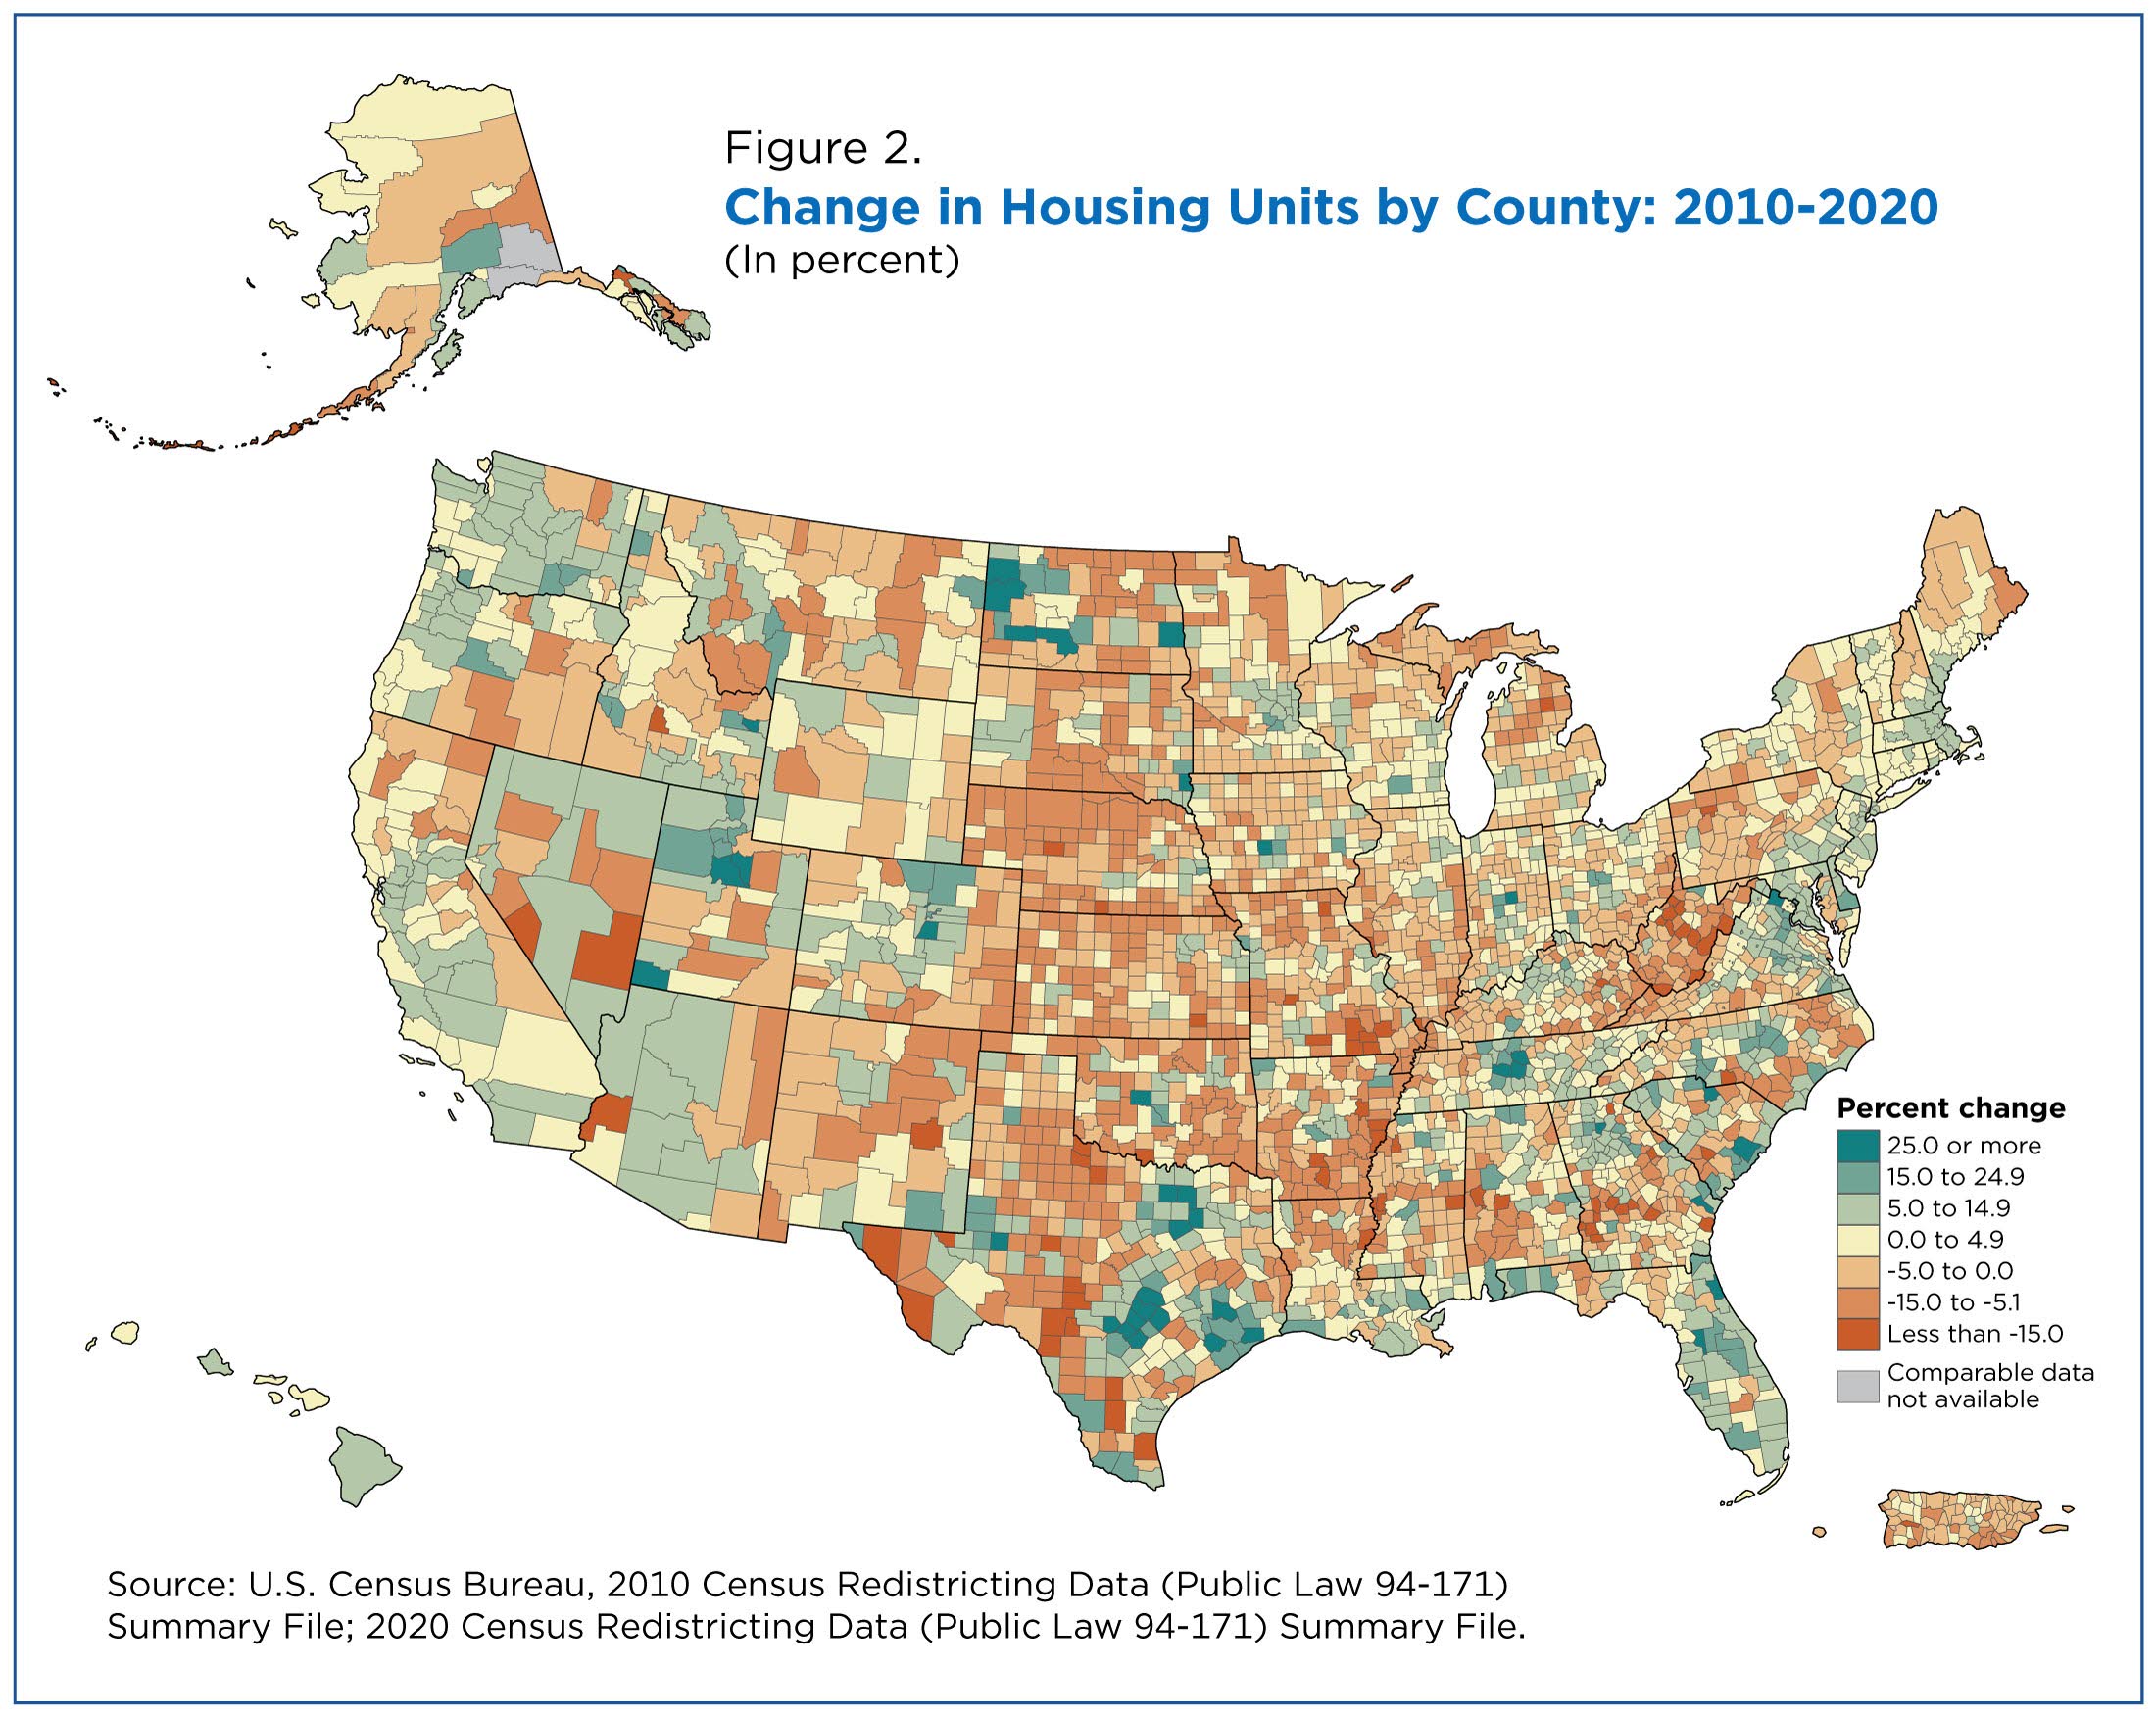
While the national number of housing units grew over the past decade, this growth was not uniform throughout the country (Figure 2). In addition to some states growing faster than others, growth rates also varied across counties in the same state.
In many states, counties in metropolitan areas grew faster than those in nonmetropolitan areas. Counties that composed some part of a metropolitan or micropolitan area, also known as Core Based Statistical Areas (CBSAs), showed increases that averaged 3.8%, while counties outside of CBSAs declined on average by 3.9%.
This pattern extended to metro and micro areas as well. Counties located in central areas of CBSAs grew by nearly 4.9% on average, while those in outlying areas of the CBSAs grew by an average of only 1.2%.
This pattern helps to explain why more than half (50.7%) of counties showed declines in their total housing unit count when the national count grew by 6.7% between 2010 and 2020.
Even Texas, the state that added the most housing units, showed decreases in more than half (52.4%) of its counties — reflecting the concentration of housing unit growth in larger metropolitan counties, with declines more common in smaller non-metropolitan counties.
Only six states — Connecticut, Delaware, Hawaii, Massachusetts, New Jersey and Rhode Island — had more housing units in 2020 than in 2010 in every one of their counties.
West Virginia and Puerto Rico, the only two areas that lost units overall, had the highest proportion (80%) of counties that lost housing units.
Where People Live
Changes in the number of housing units from 2010 to 2020 resulted from macroeconomic changes and other factors that affect where people live and build homes.
The decennial census is the most accurate and effective source of information for capturing these shifts, especially for smaller geographies and historically harder-to-reach populations.
The 2020 Census housing unit counts also provide the foundation for the Census Bureau’s American Community Survey and the American Housing Survey, which will provide additional details about the U.S. housing stock and the shifts that develop over the next decade.
Evan Brassell is chief of the Census Bureau’s Housing Statistics Branch in the Social, Economic and Housing Statistics Division.

Where this page came from
This page was imported from U.S. Census Bureau. Published by the U.S. Census Bureau and, as a work of the United States government, in the public domain; material credited to others is left out.
Nobody has written it yet — it is the source material at a new address, which is why search engines are asked to skip it and why no one earns from it. It is up for grabs: take it on, and it is yours to rewrite and to earn from.
Licens: CC0 1.0 (allmän egendom) · Bearbetat efter www.census.gov
1
0
0
0

Kommentarer