
Ser du något att förbättra? Föreslå en ändring.
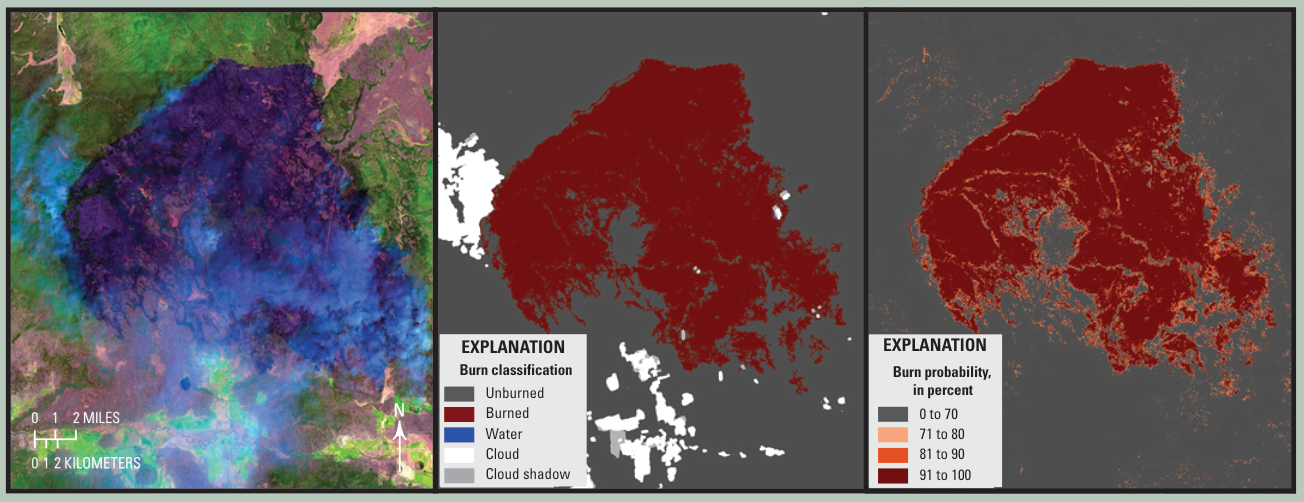
The Bootleg fire in Oregon on July 11, 2021: left, a Landsat 8 surface reflectance image (bands 6, 5 and 4); center, burn classification; right, burn probability. USGS images.
Why it's needed
Accurate, complete data on where fires burned are needed to track trends and patterns of fire, understand what drives it, project how fire will behave in the future, and assess its effects on natural and social systems.
The Landsat Collection 2 Level-3 Burned Area (BA) science product is designed to identify burned areas across all ecosystems — forests, shrublands and grasslands among them — in Landsat 4–9 data.
How it works
- Inputs: it is generated from Landsat Collection 2 U.S. Analysis Ready Data surface reflectance and top-of-atmosphere brightness temperature data.
- Burn probability: the maximum per-pixel probability of burning, found by comparing each new acquisition with composites made from the seasonal average and the previous year.
- Burn classification: whether an area burned, found by applying a threshold to the burn probability.
- Grid: 30-meter pixels in the Albers Equal-Area Conic projection on the WGS 84 datum, on fixed, non-overlapping tiles.
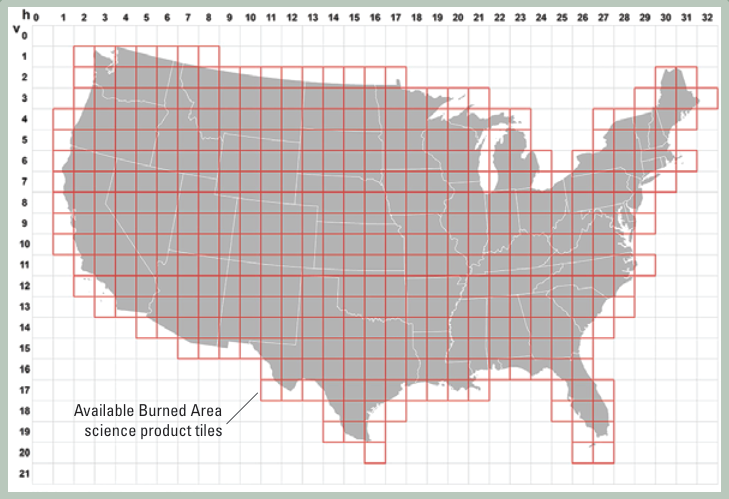
The Burned Area product's tiles over the conterminous United States, on a horizontal (h) and vertical (v) grid. USGS map.
Coverage
The conterminous United States:
| Sensor | Dates |
|---|---|
| Landsat 9 Operational Land Imager | October 2021 to present |
| Landsat 8 Operational Land Imager | April 2013 to present |
| Landsat 7 Enhanced Thematic Mapper Plus | July 1999 to April 2022 |
| Landsat 5 Thematic Mapper | March 1984 to May 2012 |
| Landsat 4 Thematic Mapper | March 1984 to September 1992 |
What changed in Collection 2
No major changes, but some updates:
- A browse file was added.
- A bug was fixed: in Collection 1, pixels in the top row (the northern edge) and left column (the western edge) of each tile were wrongly classed as unburned.
- Diagonal growth: data can now grow diagonally, not only up, down and sideways.
- Retraining: the model was retrained after an upgrade to Python 3, which caused minor differences in the output.
The files
| File | Contents |
|---|---|
| tileID_BP.TIF | burn probability raster |
| tileID_BC.TIF | burn classification raster |
| tileID.png | browse image: a false-color composite (shortwave infrared 2 / near infrared / green) with the probability and classification plots, for a quick visual check |
| tileID_BA.XML | metadata (also provided as JSON) |
Getting and citing it
Download from EarthExplorer — under Landsat › Landsat Collection 2 Level-3 Science Products or Landsat C2 U.S. Analysis Ready Data (ARD), listed as "Landsat 4-9 C2 Burned Area" — or through the commercial cloud.
The suggested credit is "Landsat Collection 2 Level-3 Burned Area Science Product courtesy of the U.S. Geological Survey," along with Hawbaker and others (2020), "The Landsat Burned Area algorithm and products for the United States," Remote Sensing of Environment 244: 111801.
Sources
Based on U.S. Geological Survey, "Landsat Collection 2 Level-3 Burned Area Science Product," Fact Sheet 2022–3083, USGS; a work of the United States government in the public domain. The figures are restored from the fact sheet's PDF. The source gives the tile size as 5,000 square meters in its text and 5,000 square miles in a caption; this page gives neither.
Licens: CC0 1.0 (allmän egendom) · Bearbetat efter pubs.usgs.gov
1
0
0
0

Kommentarer


