Ser du något att förbättra? Föreslå en ändring.
Den här sidan är offentlig.
I Principles of Economics 2e (OpenStax) · sida 87 av 142
Learning Objectives
By the end of this section, you will be able to:
- Analyze graphs of the current account balance and the merchandise trade balance
- Identify patterns in U.S. trade surpluses and deficits
- Compare the U.S. trade surpluses and deficits to other countries' trade surpluses and deficits
We present the history of the U.S. current account balance in recent decades in several different ways. Figure 23.2 (a) shows the current account balance and the merchandise trade balance in dollar terms. Figure 23.2 (b) shows the current account balance and merchandise account balance yet again, this time as a share of the GDP for that year. By dividing the trade deficit in each year by GDP in that year, Figure 23.2 (b) factors out both inflation and growth in the real economy.
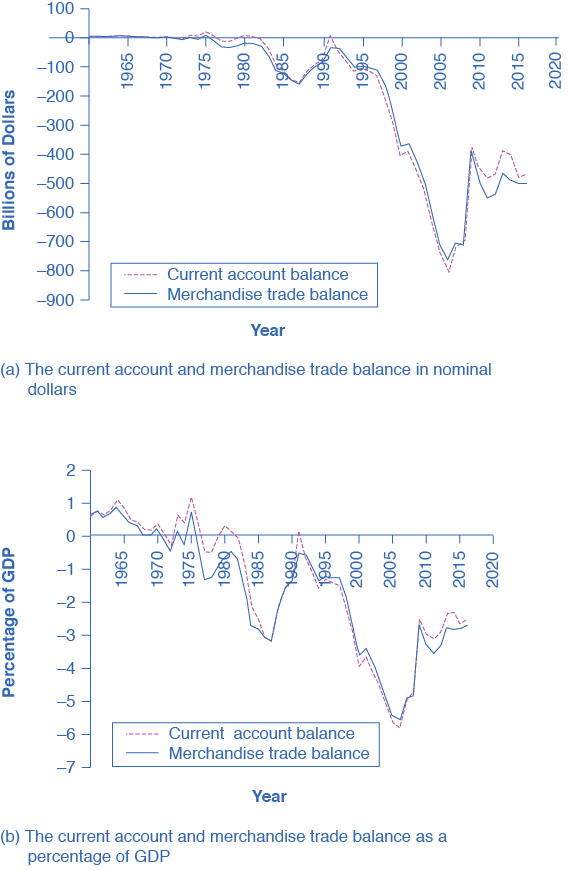
Figure 23.2. Current Account Balance and Merchandise Trade Balance, 1960–2015 (a) The current account balance and the merchandise trade balance in billions of dollars from 1960 to 2015. If the lines are above zero dollars, the United States was running a positive trade balance and current account balance. If the lines fall below zero dollars, the United States is running a trade deficit and a deficit in its current account balance. (b) This shows the same items—trade balance and current account balance—in relationship to the size of the U.S. economy, or GDP, from 1960 to 2015.
By either measure, the U.S. balance of trade pattern is clear. From the 1960s into the 1970s, the U.S. economy had mostly small trade surpluses—that is, the graphs in Figure 23.2 show positive numbers. However, starting in the 1980s, the trade deficit increased rapidly, and after a tiny surplus in 1991, the current account trade deficit became even larger in the late 1990s and into the mid-2000s. However, the trade deficit declined in 2009 after the recession had taken hold, then rebounded partially in 2010 and has remained stable up through 2016.
Current Account Balance in Billions of Dollars.
Table 23.4 shows the U.S. trade picture in 2013 compared with some other economies from around the world. While the U.S. economy has consistently run trade deficits in recent years, Japan and many European nations, among them France and Germany, have consistently run trade surpluses. Some of the other countries listed include Brazil, the largest economy in Latin America; Nigeria, along with South Africa competing to be the largest economy in Africa; and China, India, and Korea. The first column offers one measure of an economy's globalization: exports of goods and services as a percentage of GDP. The second column shows the trade balance. Usually, most countries have trade surpluses or deficits that are less than 5% of GDP. As you can see, the U.S. current account balance is –2.6% of GDP, while Germany's is 8.4% of GDP.
| Exports of Goods and Services | Current Account Balance | |
|---|---|---|
| United States | 17.6% | –2.6% |
| Japan | 16.2% | 3.1% |
| Germany | 46.8% | 8.4% |
| United Kingdom | 27.2% | –5.4% |
| Canada | 31.5% | –3.2% |
| Sweden | 45.6% | 5.2% |
| Korea | 45.9% | 7.7% |
| Mexico | 35.4% | –2.9% |
| Brazil | 13.0% | –3.3% |
| China | 22.1% | 3.0% |
| India | 19.9% | –1.1% |
| Nigeria | 10.7% | -3.3% |
| World | - | 0.0% |
Table 23.4 Level and Balance of Trade in 2015 (figures as a percentage of GDP, Source: http://data.worldbank.org/indicator/BN.CAB.XOKA.GD.ZS )
Where this page came from
This page was imported from OpenStax, Principles of Economics 2e. Section 23.2 of Principles of Economics 2e by Steven A. Greenlaw, David Shapiro, published by OpenStax (Rice University) under CC BY 4.0; the book is free at openstax.org. Changed here: set as a page on its own.
Nobody has written it yet — it is the source material at a new address, which is why search engines are asked to skip it and why no one earns from it. It is up for grabs: take it on, and it is yours to rewrite and to earn from.
I dessa publikationerPrinciples of Economics 2e (OpenStax)
Licens: CC BY 4.0 · Bearbetat efter openstax.org
Kommentarer