Vill du förbättra sidans innehåll? Föreslå en ändring.
Nicole Luisi, MPH, MS1; Patrick S. Sullivan, PhD1; Travis Sanchez, PhD1; Heather Bradley, PhD1; Mansour Fahimi, PhD2; Kayoko Shioda, PhD3; Kristin N. Nelson, PhD1; Benjamin A. Lopman, PhD1,3; Aaron J. Siegler, PhD1 (
Summary
What is already known about this topic?
During January 2022, the White House launched COVIDTests.gov, a program through which all U.S. households could order free-to-the-user at-home test kits from the federal government, distributed by the U.S. Postal Service.
What is added by this report?
Awareness and acceptability of the COVIDTests.gov program is high. COVIDTests.gov test kits have improved access to COVID-19 testing, with more than 40 million households using at least one kit. The program helped to improve equity of COVID-19 home test use; non-Hispanic Black or African American (Black) and non-Hispanic White persons had similar use of COVIDTests.gov kits, and Black persons were 72% less likely to use other modalities for home-based testing.
What are the implications for public health practice?
National programs to address availability and accessibility of critical health services in a pandemic response have substantial health value.
Figures
Related Materials
Close
Download Image[JPG]
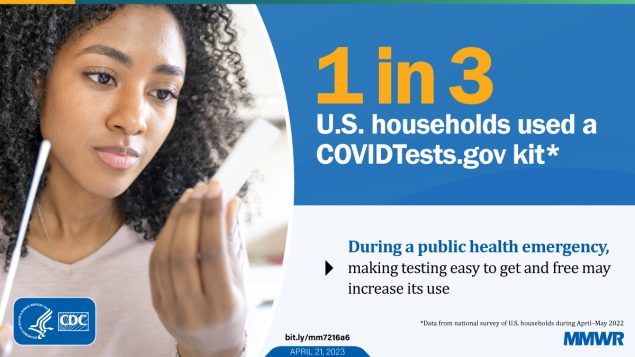
At-home rapid antigen COVID-19 tests were first authorized by the Food and Drug Administration in late 2020 (1–3). In January 2022, the White House launched COVIDTests.gov, which made all U.S. households eligible to receive free-to-the-user at-home test kits distributed by the U.S. Postal Service (2). By May 2022, more than 70 million test kit packages had been shipped to households across the United States (2); however, how these kits were used, and which groups were using them, has not been reported. Data from a national probability survey of U.S. households (COVIDVu), collected during April–May 2022, were used to evaluate awareness about and use of these test kits (4). Most respondent households (93.8%) were aware of the program, and more than one half (59.9%) had ordered kits. Among persons who received testing for COVID-19 during the preceding 6 months, 38.3% used a COVIDTests.gov kit. Among kit users, 95.5% rated the experience as acceptable, and 23.6% reported being unlikely to have tested without the COVIDTests.gov program. Use of COVIDTests.gov kits was similar among racial and ethnic groups (42.1% non-Hispanic Black or African American [Black]; 41.5% Hispanic or Latino [Hispanic]; 34.8% non-Hispanic White [White]; and 53.7% non-Hispanic other races [other races]). Use of other home COVID-19 tests differed by race and ethnicity (11.8% Black, 44.4% Hispanic, 45.8% White, 43.8% other races). Compared with White persons, Black persons were 72% less likely to use other home test kits (adjusted relative risk [aRR] = 0.28; 95% CI = 0.16–0.50). Provision of tests through this well-publicized program likely improved use of COVID-19 home testing and health equity in the United States, particularly among Black persons. National programs to address availability and accessibility of critical health services in a pandemic response have substantial health value.
Methods of the national COVIDVu survey have been previously reported (4). In brief, a national address-based household sample derived from the U.S. Postal Service Computerized Delivery Sequence File, which covers nearly all residential delivery points in all 50 U.S. states, was recruited. During August–December 2020, 39,500 addresses were selected in a probability sample, and one household member aged ≥18 years from each address was randomly selected to participate (4,5). Among 5,666 (15.3%) respondents who completed a baseline survey, 4,654 (12.6% of sampled households; 82.1% of those who completed a baseline survey) were eligible to participate in follow-up survey rounds, based on completion of study procedures (5). Weights were derived using raking* and trimming† procedures. Demographic and geographic data were used to develop person- and household-level weights, with additional adjustments for kit ordering using the publicly available figure of 70 million COVIDTests.gov orders shipped to households (2). Extreme weights were trimmed and readjusted to reach the total sum of households and noninstitutionalized adults aged ≥18 years in the United States. Among 4,654 participants enrolled at baseline (5), 3,400 (73%) completed an online follow-up survey during April 14–May 13, 2022. Data from the 3,400 responses were weighted to allow for national estimates of COVIDTests.gov use among U.S. households (128,674,487) and adults aged ≥18 years (252,117,111). Participants were asked to specify any COVID-19 tests they had received during the previous 6 months (e.g., laboratory, pharmacy, doctor’s office, drive through site, government home test kit, or other home test kit). Awareness of the COVIDTests.gov program was assessed based on response to the question “Did you know that the government is offering free COVID-19 home test kits that can be ordered and mailed to your home?” Participants who answered “Yes” were asked if their household had ordered any of these government test kits, and whether these kits had been used by them or someone else. Those who used a government kit to self-administer a test during the previous 6 months were asked questions about the acceptability and use of the test kit. Sociodemographic variables were self-reported at baseline; weighted estimates and two-sided 95% CIs were prepared for the full sample and for the subset of respondents reporting use of a COVIDTests.gov kit. To evaluate the association between race and ethnicity and different testing modalities, aRRs and 95% CIs were estimated using weighted multivariable negative binomial regression; models were adjusted for age, sex, region, education, income, household size, and vaccination status.
All analyses were conducted using SAS statistical software (version 9.4; SAS Institute). The COVIDVu study was approved by the Emory University Institutional Review Board.
In May 2022, an estimated 93.8% (120,730,524) of U.S. households were aware of the COVIDTests.gov program, and 59.9% (77,089,010) of households had ordered government kits (
Among an estimated 252,117,111 adults, 154,160,315 (61.1%) lived in a household that had ordered kits (
Nearly one quarter (23.6%) of persons using the government kits (more than 13 million persons) indicated that they would have been unlikely to test for COVID-19 if COVIDTests.gov kits were not available; 29.7% of kit users had not used any other type of test during the preceding 6 months. The survey did not collect information about test results from each test used, but 22.2% of COVIDTests.gov kit users reported at least one positive test result within this period. Among those who used a COVIDTests.gov kit, more than 95% rated the experience as very acceptable (64.1%) or acceptable (31.4%).
Among 166,128,467 (65.9%) adults who received testing for COVID-19 during the previous 6 months, 44.2% received a laboratory or clinic test, 25.7% received a drive-through test, 38.3% used a COVIDTests.gov kit, and 42.1% used another type of at-home self-test kit (e.g., pharmacy) (
Discussion
In a probability sample of U.S. households, both awareness of the COVIDTests.gov program and use of kits were high, with more than 41 million households estimated to have used kits during January–May 2022. This number is likely a lower bound estimate because households might not have had sufficient time to use their ordered test kits at the time of the survey.
Prevalences of COVID-19 testing using the COVIDTests.gov kits were similar among racial and ethnic groups, a considerable difference from the highly inequitable use of other home self-tests for Black respondents observed both in this survey and in previous estimates (3). Racial and ethnic disparities in COVID-19 illness have been widely reported (6), as have concerns about the cost and accessibility of at-home tests (7). Long-term availability of government test kits appears to have significantly improved access to COVID-19 testing for racial and ethnic minorities, underscoring a critically important and successful element of the national COVID-19 response.
The findings in this report are subject to at least one limitation. Survey weights were used to establish estimates that represent the U.S. population; however, COVIDVu respondents might have been more likely to practice preventive measures such as vaccination and testing. To adjust for this potential bias, publicly available data on COVIDTests.gov kit orders were used as part of the weighting process, ensuring that the overall estimate of kit ordering is realistic; however, other sources of bias not addressed by weighting procedures might remain.
These data indicate that provision of free COVID-19 tests through the COVIDTests.gov program was not only widely used, but also provided a mechanism for millions of persons to receive COVID-19 testing who otherwise might not have. Moreover, this program likely led to improvement in equity of COVID-19 testing. The COVIDTests.gov program was provided continuously until September 2, 2022, when it was paused; the site was reactivated on December 19, 2022 (8). These findings support the substantial health value of national programs that address critical health needs during a pandemic response.
Acknowledgments
The COVIDVu study team; Salesforce.
Corresponding author: Nicole Luisi, nluisi@emory.edu.
1Department of Epidemiology, Rollins School of Public Health, Emory University, Atlanta, Georgia; 2Marketing Systems Group, Philadelphia, Pennsylvania; 3Gangarosa Department of Environmental Health, Rollins School of Public Health, Emory University, Atlanta, Georgia.
All authors have completed and submitted the International Committee of Medical Journal Editors form for disclosure of potential conflicts of interest. Nicole Luisi reports institutional support from the National Institute of Allergy and Infectious Diseases (NIAID) and National Institutes of Health (NIH). Patrick S. Sullivan reports institutional support from NIH, Gilead Sciences, and Merck; receipt of consulting fees from Merck and Molecular Testing Laboratories; and honoraria from Gilead Sciences. Travis Sanchez reports institutional support from NIH. Heather Bradley reports institutional support from NIH and receipt of consulting fees from Merck. Mansour Fahimi reports support and receipt of consulting fees from Emory University. Kristin N. Nelson reports institutional support from NIAID and NIH. Benjamin A. Lopman reports grant support from the National Institute of General Medical Sciences, NIH, and personal fees from Epidemiologic Research and Methods, LLC, and Hillevax, Inc., outside the submitted work. Aaron J. Siegler reports institutional support from NIAID and NIH. No other potential conflicts of interest were disclosed.
- Raking is an iterative process that assigns a weight value to each survey respondent to ensure that the weighted distribution of the sample more closely approximates that of the sampled population. This procedure was used to align distributions with respect to gender, age, race, ethnicity, education, income, marital status, and U.S. Census Bureau region.
† Trimming is a process applied during raking to control the highest and lowest weight values. At both ends of the distribution, weights were trimmed at the 99th percentile.
References
- US Department of Health and Human Services. Biden-Harris administration requires insurance companies and group health plans to cover the cost of at-home COVID-19 tests, increasing access to free tests Press release]. Washington, DC: US Department of Health and Human Services; 2022. [https://www.hhs.gov/about/news/2022/01/10/biden-harris-administration-requires-insurance-companies-group-health-plans-to-cover-cost-at-home-covid-19-tests-increasing-access-free-tests.html
- The White House. Fact sheet: the Biden administration announces Americans can order additional free at-home, rapid COVID-19 tests at COVIDTests.gov Press release]. Washington, DC: The White House; 2022. [https://www.whitehouse.gov/briefing-room/statements-releases/2022/05/17/fact-sheet-the-biden-administration-announces-americans-can-order-additional-free-at-home-rapid-covid-19-tests-at-covidtests-gov/
- Rader B, Gertz A, Iuliano AD, et al. Use of at-home COVID-19 tests—United States, August 23, 2021–March 12, 2022. MMWR Morb Mortal Wkly Rep 2022;71:489–94. https://doi.org/10.15585/mmwr.mm7113e1 PMID:35358168
- Siegler AJ, Sullivan PS, Sanchez T, et al. Protocol for a national probability survey using home specimen collection methods to assess prevalence and incidence of SARS-CoV-2 infection and antibody response. Ann Epidemiol 2020;49:50–60. https://doi.org/10.1016/j.annepidem.2020.07.015 PMID:32791199
- Sullivan PS, Siegler AJ, Shioda K, et al. Severe acute respiratory syndrome coronavirus 2 cumulative incidence—United States, August 2020–December 2020. Clin Infect Dis 2022;74:1141–50. https://doi.org/10.1093/cid/ciab626 PMID:34245245
- Mackey K, Ayers CK, Kondo KK, et al. Racial and ethnic disparities in COVID-19–related infections, hospitalizations, and deaths: a systematic review. Ann Intern Med 2021;174:362–73. https://doi.org/10.7326/M20-6306 PMID:33253040
- Jean S, Burnham CD, Chapin K, et al. At-home testing for infectious diseases: the laboratory where you live. Clin Chem 2021;68:19–26. https://doi.org/10.1093/clinchem/hvab198 PMID:34969103
- The White House. Fact sheet: Biden administration announces COVID-19 winter preparedness plan Press release]. Washington, DC: The White House; 2022. [https://www.whitehouse.gov/briefing-room/statements-releases/2022/12/15/fact-sheet-biden-administration-announces-covid-19-winter-preparedness-plan/
###
- Based on a national probability sample (COVIDVu).
† Household-level weights were derived with raking and a trimming procedure. Demographic and geographic data were used to develop person-level weights, which were adjusted to create household-level weights based on the joint distribution of households within each geographic region of the United States, total number of adults and children in the home, household income, and home ownership. The publicly available benchmark of 70 million household COVIDTests.gov orders was used to adjust the person- and household-level weights. Extreme weights were trimmed and readjusted to sum to 128 million total U.S. households.
§ Test kit use includes any COVIDTests.gov kit use by resident or nonresident of household.
¶ Percentage of estimated total 128,674,487 U.S. households.
| Characteristic | All adults (N = 252,117,111) | Used a COVIDTests.gov test kit (n = 63,663,434) | ||
|---|---|---|---|---|
| Weighted, no. | Weighted, % (95% CI) † | Weighted, no. | Weighted, % (95% CI) § | |
| COVIDTests.gov kits ordered within household | 154,160,315 | 61.1 (58.0–64.2) | 63,663,434 | 41.3 (38.0–44.7) |
| Race and ethnicity | ||||
| Black or African American, non-Hispanic | 25,850,841 | 10.3 (8.4–12.5) | 6,858,446 | 41.4 (30.2–53.6) |
| White, non-Hispanic | 164,393,188 | 65.2 (62.2–68.1) | 37,028,796 | 38.4 (34.6–42.3) |
| Hispanic or Latino | 40,170,347 | 15.9 (13.8–18.4) | 11,944,942 | 47.8 (38.9–56.8) |
| Other races, non-Hispanic | 21,702,735 | 8.6 (7.0–10.5) | 7,831,250 | 48.5 (37.4–59.8) |
| Sex | ||||
| Female | 136,155,934 | 54.0 (51.0–57.0) | 38,013,147 | 42.0 (37.8–46.3) |
| Male | 115,961,177 | 46.0 (43.0–49.0) | 25,650,287 | 40.3 (35.0–46.0) |
| Age group, yrs | ||||
| 18–34 | 69,765,556 | 27.7 (25.0–30.6) | 18,049,996 | 54.6 (47.1–61.9) |
| 35–44 | 42,951,172 | 17.0 (14.9–19.4) | 13,559,996 | 50.9 (43.0–58.7) |
| 45–54 | 40,515,793 | 16.1 (14.1–18.3) | 10,029,549 | 35.2 (27.9–43.3) |
| 55–64 | 42,767,176 | 17.0 (15.0–19.2) | 11,973,956 | 42.1 (34.7–49.9) |
| ≥65 | 56,117,414 | 22.3 (19.9–24.8) | 10,049,937 | 26.8 (21.3–33.0) |
| U.S. Census Bureau region ¶ | ||||
| Northeast | 44,036,175 | 17.5 (15.2–19.9) | 14,330,946 | 46.3 (38.3–54.5) |
| Midwest | 53,575,092 | 21.3 (18.8–23.9) | 11,451,840 | 40.0 (32.3–48.3) |
| South | 92,920,639 | 36.9 (34.0–39.8) | 20,006,130 | 35.2 (29.8–41.0) |
| West | 61,585,205 | 24.4 (22.1–26.9) | 17,874,519 | 47.4 (41.7–53.2) |
| Education | ||||
| High school diploma, GED, or less | 84,356,738 | 33.5 (30.3–36.8) | 18,849,902 | 39.5 (31.7–47.8) |
| Some college or associate degree | 73,360,945 | 29.1 (26.6–31.7) | 16,772,376 | 40.6 (35.0–46.4) |
| Bachelor’s degree | 59,827,173 | 23.7 (21.7–25.9) | 17,166,926 | 42.9 (37.8–48.1) |
| Graduate degree | 34,572,255 | 13.7 (12.3–15.3) | 10,874,231 | 43.4 (37.9–49.1) |
| Income, US$ | ||||
| 0–24,999 | 30,092,036 | 11.9 (10.1–14.0) | 5,463,583 | 41.0 (31.0–51.7) |
| 25,000–49,999 | 42,687,868 | 16.9 (14.7–19.4) | 9,413,207 | 39.3 (30.9–48.5) |
| 50,000–99,999 | 73,698,765 | 29.2 (26.6–32.0) | 20,287,832 | 44.0 (37.8–50.4) |
| 100,000–199,999 | 72,574,972 | 28.8 (26.2–31.5) | 20,189,928 | 42.5 (36.5–48.8) |
| ≥200,000 | 33,063,470 | 13.1 (11.3–15.1) | 8,308,883 | 35.6 (28.4–43.6) |
| Household size | ||||
| 1–2 persons | 151,075,517 | 59.9 (56.9–62.8) | 35,303,476 | 38.2 (34.1–42.4) |
| ≥3 persons | 101,041,594 | 40.1 (37.2–43.1) | 28,359,958 | 46.0 (40.5–51.7) |
| No. of COVID-19 vaccine doses received | ||||
| None | 24,619,675 | 9.8 (7.9–12.0) | 3,650,426 | 36.3 (22.5–52.6) |
| 1 | 8,589,424 | 3.4 (2.4–4.7) | 1,485,647 | 42.5 (26.3–60.4) |
| 2 | 59,427,771 | 23.6 (21.0–26.4) | 11,371,227 | 40.3 (32.1–49.0) |
| 3 | 143,095,746 | 56.8 (53.7–59.7) | 43,357,811 | 43.0 (39.0–47.2) |
| >3 | 16,384,496 | 6.5 (5.2–8.0) | 3,798,322 | 32.7 (23.6–43.3) |
| COVID-19 testing, previous 6 mos | ||||
| Did not test | 85,988,644 | 34.1 (31.3–37.1) | NA | NA |
| Tested, used at least one COVIDTests.gov test | 63,663,434 | 25.3 (22.9–27.8) | NA | NA |
| Tested, did not use a COVIDTests.gov test | 102,465,033 | 40.6 (37.7–43.6) | NA | NA |
| COVIDTests.gov test kit use in household ** | ||||
| Used for self | 63,663,434 | 41.3 (38.0–44.7) | NA | NA |
| Used by household member | 42,511,539 | 27.6 (25.0–31.0) | NA | NA |
| Used by someone else | 5,823,485 | 3.8 (2.7–5.3) | NA | NA |
| Test kits haven’t arrived | 3,420,382 | 2.2 (1.2–4.1) | NA | NA |
| No use of test kits | 70,591,623 | 45.8 (42.4–49.2) | NA | NA |
| Other characteristics of COVIDTests.gov kit users, previous 6 mos †† | ||||
| Used only COVIDTests.gov kit | 18,534,473 | 29.7 (24.9–35.1) | NA | NA |
| Unlikely to test without COVIDTests.gov kit | 13,884,660 | 23.6 (19.3–28.4) | NA | NA |
| Rating of COVIDTests.gov kit use experience | ||||
| Very acceptable | 32,053,174 | 64.1 (57.9–69.9) | NA | NA |
| Acceptable | 15,676,552 | 31.4 (25.9–37.4) | NA | NA |
| Neutral or unacceptable | 2,248,190 | 4.5 (2.3–8.7) | NA | NA |
| Had any positive COVID-19 test result | 14,133,748 | 22.2 (18.1–26.9) | NA | NA |
- From a national probability sample (COVIDVu).
† Percentages calculated as column percents, unless otherwise specified.
§ Percentages calculated as row percentages. Denominator includes only respondents living in households that ordered COVIDTests.gov test kits.
¶ https://www2.census.gov/geo/pdfs/maps-data/maps/reference/us_regdiv.pdf
** Categories are not mutually exclusive. Denominator includes only respondents living in households that ordered COVIDTests.gov test kits.
†† Denominator includes only respondents who used COVIDTests.gov test kits. Denominators in this section excluded the following missing values: used only COVIDTests.gov kit, n = 1,299,627; unlikely to test without COVIDTests.gov kit, n = 4,713,097; and rating of COVIDTests.gov kit use experience, n = 13,685,518.
###
- Lab or clinic tests were used by 72,777,029 (44.2%), drive-through tests by 42,386,207 (25.7%), COVIDTests.gov tests by 63,663,434 (38.3%) and other home tests by 69,331,543 (42.1%) persons who received testing during the previous 6 months.
† With 95% CI indicated by error bars.
§ Data for use of lab or clinic, drive-through, and other home tests were missing for a small proportion (¶ A national probability sample.
Where this page came from
This page was imported from Centers for Disease Control and Prevention. Material produced by the Centers for Disease Control and Prevention is a work of the United States government and is in the public domain.
Nobody has written it yet — it is the source material at a new address, which is why search engines are asked to skip it and why no one earns from it. It is up for grabs: take it on, and it is yours to rewrite and to earn from.
Licens: CC0 1.0 (allmän egendom) · Bearbetat efter www.cdc.gov
1
0
0
0

Kommentarer
Läs härnäst