Ser du något att förbättra? Föreslå en ändring.
1169 U.S. GEOLOGICAL SURVEY CIRCULAR
CONTENTS
National Water-Quality Assessment Program ..............
Summary of major issues and findings.........................
Environmental setting and hydrologic conditions ........
Major issues and findings .............................................
(A) Background water quality ....................................
(B) Agriculture and water quality...............................
(C) Red River water quality and nonagricultural sources of contamination .......................................... 12
(D) Effects of other nonpoint-source toxic compounds on water quality ..................................... 13
(E) Sediment in streams.............................................. 14
(F) Importance of variations in water quality ............. 16
Water-quality conditions in a national context ............. 18
Study design and data collection .................................. 22
Summary of compound detections and concentrations ........................................................... 24
NATIONAL WATER-QUALITY ASSESSMENT PROGRAM
of the implications to human and aquatic health and because of the significant costs associated with decisions involving land and water management, conservation, and regulation. In 1991, the U.S. Congress appropriated funds for the U.S. Geological Survey (USGS) to begin the National Water-Quality Assessment (NAWQA) Program to help meet the continuing need for sound, scientific information on the areal extent of the water-quality problems, how these problems are changing with time, and an understanding of the effects of human actions and natural factors on water-quality conditions.
The NAWQA Program is assessing the water-quality conditions of more than 50 of the Nation's largest river basins and aquifers, known as Study Units. Collectively, these Study Units cover about one-half of the United States and include sources of drinking water used by about 70 percent of the U.S. population. Comprehensive assessments of about one-third of the Study Units are ongoing at a given time. Each Study Unit is scheduled to be revisited every decade to evaluate changes in water-quality conditions. NAWQA assessments rely heavily on existing information collected by the USGS and many other agencies as well as the use of nationally consistent study designs and methods of sampling and analysis. Such consistency simultaneously provides information about the status and trends in water-quality conditions in a particular stream or aquifer and, more importantly, provides the basis to make comparisons among watersheds and improve our understanding of the factors that affect water-quality conditions regionally and nationally.
This report is intended to summarize major findings that emerged between 1992 and 1995 from the water-quality assessment of the Red River of the North Basin Study Unit and to relate these findings to water-quality issues of regional and national concern. The information is primarily intended for those who are involved in waterresource management. Indeed, this report addresses many of the concerns raised by regulators, water-utility managers, industry representatives, and other scientists, engineers, public officials, and members of stakeholder groups who provided advice and input to the USGS during this NAWQA Study-Unit investigation. Yet, the information contained here may also interest those who simply wish to know more about the quality of water in the rivers and aquifers in the area where they live.
Robert M. Hirsch, Chief Hydrologist
U.S. Geological Survey Circular 1169 As a representative of a Canadian natural resources agency, I feel that the extensive knowledge generated by the NAWQA study of the Red River on key environmental issues and underlying processes has given Canadian stakeholders a better understanding of transboundary issues and will contribute significantly to the management of the entire watershed. Dr. John Wood, Red River NAWQA liaison committee member for Environment Canada, Regina, Saskatchewan
SUMMARY OF MAJOR ISSUES AND FINDINGS Their Implications in the Red River of the North Basin
Major Finding
(A) Background Water Quality.
Stream quality and basic water quality (as defined by concentrations of major ions) in surficial aquifers are not uniform in the Red River of the North Basin Study Unit (fig. 1). The differences in water quality generally can be related to differences in geology, soils, and hydrology in four subregions in the basin. Saline seeps from deep ground-water sources affect streams in the northwestern portion of the Study Unit during times of extremely low streamflow.
(B) Agriculture and Water Quality.
Pesticide concentrations were mostly related to factors such as chemical persistence and rate of water movement over and through agricultural soils. In this largely agricultural area, the most heavily applied pesticides, which included the herbicides 2,4-D, MCPA, bromoxynil, and trifluralin, were not always the most frequently detected in streams and shallow aquifers. Atrazine, applied at about 7 percent of the rate of 2,4-D, was detected in streams throughout the basin and shallow ground water beneath cropland. The presence of the banned insecticide DDT and some of its breakdown products in stream-bottom sediments, fish tissues, and in some ground water illustrates the persistence of some pesticides.
Streams draining areas containing the largest percentage of cropland (central and southern parts of the Red River of the North Basin Study Unit) had the highest concentrations of nutrients (dissolved phosphorus, nitrate, and organic nitrogen). Nitrate concentrations generally were low in shallow ground water except in some surficial aquifers beneath cropland, where concentrations exceeded the USEPA 10 mg/L drinking-water standard in 27, 0, and 8 percent of the samples from the western, central, and southeastern parts of the Study Unit, respectively. Nitrate and pesticide concentrations were well below drinking-water standards in ground water deeper than these aquifers, particularly buried aquifers naturally protected by overlying sediments.
Fish communities were affected more by differences in natural environmental factors (some of which are affected by land use) than by differences in the concentrations of nutrients and pesticides in streams in agricultural areas.
Water Quality in the Red River of the North Basin, Minnesota, North Dakota, and South Dakota, 1992–95
Implication
Water in the Red River of the North Basin, when unaffected by human activities, generally is safe to drink according to U.S. Environmental Protection Agency (USEPA) standards for dissolved solids, major ions, and radionuclides. Natural differences in water quality are important factors for water and land management. [See pages 6–7.]
Pesticides detected in streams and shallow ground water did not exceed any drinking-water standards and, except for a single concentration of the herbicide triallate, were not acutely toxic to aquatic life based on current standards. USEPA has established drinking-water standards for 6 individual pesticides out of the 43 detected in the basin. The health effects of other pesticides or combinations of pesticides was not assessed. Some insecticides and most fungicides applied to specialty crops in this basin were not analyzed in this study. Pesticide persistence and its dependence on soil characteristics and hydrologic conditions suggest the importance of considering soil, geology, and hydrology in developing and implementing land-management plans. [See pages 8–9.] Although the nutrient concentrations were relatively low, agricultural activity has increased the concentration and load of nutrients [see pages 10–11] potentially degrading stream quality and increasing eutrophication of lakes and reservoirs. [See page 12.] Ground water most commonly used for domestic and public water supplies in the basin was safe to drink according to USEPA standards for nitrate and pesticides. Detectable concentrations of nutrients and pesticides that have reached ground water indicate the potential for further contamination over time. Shallow ground water beneath sandy soils is particularly vulnerable to contamination, and this study provided a perspective on how decades of agricultural activity affects the current variability of ground-water quality. [See pages 8–11.]
More work would be useful to better assess the effects of land use, nutrients, and pesticides on the aquatic ecosystem. [See page 11.] Wastewater from urban areas along the Red River of the North has a minimal effect on the river’s quality. The median concentration of ammonia, commonly associated with wastewater, was not higher in the river than in the tributaries, but ammonia concentration was slightly higher in the river downstream from the Fargo-Moorhead area. Compared to historical data for the river, concentrations of ammonia have decreased and nitrate have increased slightly downstream from the Fargo-Moorhead area. These trends likely reflect improved aeration of wastewater effluent over time.
Mercury, polychlorinated biphenyls (PCBs), and polycyclic aromatic hydrocarbons (PAHs) (potentially toxic chemicals that are associated with modern industrial sources) were widely detected in Red River of the North Basin Study Unit fish and (or) stream sediments.
Volatile organic compounds (VOCs), sampled in selected shallow aquifers and in the Red River of the North under ice conditions, were detected infrequently and at concentrations well below drinking-water standards.
High suspended-sediment concentrations characterize streams that flow through the heavily cropped central part of the basin. The highest sediment concentrations coincided with high stream gradient, high streamflows, and erodible stream channels, such as were characteristic of the Pembina River, a tributary to the Red River of the North (fig. 2).
The highest measured concentrations of herbicides commonly were detected during the first runoff events after application. The herbicide triallate (applied mostly during autumn) and nutrients were transported to streams during spring-snowmelt runoff. Relatively minor differences in the timing of recharge, agricultural practices, and geology can cause significant differences in magnitudes and fluctuations of nitrate concentrations in shallow ground water. Seasonal variation in flow affects available habitat and fish community composition (an indicator of stream quality).
Major Finding
(C) Red River Water Quality and Nonagricultural Sources of Contamination.
(D) Effects of other Nonpoint-Source Toxic Compounds on Water Quality.
(E) Sediment in Streams.
(F) Importance of Variations in Water Quality.
Implication
Fargo, North Dakota and Moorhead, Minnesota, the largest urban area in the basin, moderately affected Red River of the North water quality during flow conditions observed from 1993 to 1995. Ammonia concentrations were elevated at the point of discharge but were diluted by the river and tributary flows, based on measurements 78 miles downstream at Halstad, Minnesota. This dilution effect also is apparent where industries discharge ammonia to the main stem. [See page 12.]
Mercury and PCB concentrations in fish tissue were below Federal standards for fish consumption, but some of the highest concentrations were at moderate levels based on Minnesota fish-consumption advisories. PAHs were detected in stream sediments at some locations at levels thought to adversely affect aquatic life. [See page 13.]
VOC's, which can enter water from the use of petroleum products and industrial solvents, were rarely detected in ground water beneath agricultural areas or in the Red River of the North. [See pages 10 and 13.]
Land-use practices that do not abate rapid runoff of water can increase suspended sediment in streams, thereby reducing water clarity and ecological integrity. Suspended sediment in streams can settle in reservoirs, which could require costly maintenance to restore storage capacity. Sediment delivery to streams may be an important factor for managing nutrient inputs to, and transport in, some streams. [See pages 14–15.]
Water-quality criteria and indicators used for monitoring and overall management of contamination sources for water resources in this basin could be enhanced by considering the water-quality effects of seasonal and hydrologic variability. [See pages 16–17.]
U.S. Geological Survey Circular 1169
ENVIRONMENTAL SETTING AND HYDROLOGIC CONDITIONS In the Red River of the North Basin, 1993-95
The Red River of the North (hereinafter Red River) Basin was selected as a Study Unit under the NAWQA Program because:
- The basin represents an important hydrologic region where
water is a valuable resource for the region’s economy.
- The quality of the Red River is of international concern.
- The basin represents an economically valuable agricultural
area.
- The northern location is useful for a complete understand-
ing of the Nation’s water quality.
The Red River, located near the geographic center of the North American continent, flows northward and drains an area that is largely a glacial lake plain. The Red River Basin Study Unit (figs. 1 and 2) includes the surface drainage to the Red River and Roseau River within the United States. The Devils Lake Basin is not part of the Study Unit.
To assess the water quality in the basin, the Study Unit was divided into four subregions (fig. 2) that represent reasonably homogeneous environmental conditions of climate, topography, geology, soils, and land use and land cover. These environmental conditions can affect the amounts and concentrations of chemicals, sediment, and biota in water.

Figure 1. The Red River of the North Basin Study Unit is located in Minnesota, North Dakota, and South Dakota. The Red River of the North flows northward into Canada.

Figure 2. The major land use in the Red River of the North Basin Study Unit is agriculture.
Water Quality in the Red River of the North Basin, Minnesota, North Dakota, and South Dakota, 1992–95
ENVIRONMENTAL SETTING AND HYDROLOGIC CONDITIONS
The 1990 population in the largely rural Red River Basin Study Unit was about 511,000. Almost one-third of the population lives along the Red River in the cities of Fargo and Grand Forks, North Dakota, and Moorhead, Minnesota. Urban runoff, treated municipal waste, and treated industrial waste from these and other cities can contain turf-applied pesticides, organic compounds, and nutrients that are discharged into the river.
Knowledge of land-use type and location is important because pesticides and nutrients applied to the soil and crops can leach into ground water or enter streams through runoff. About 81 percent of the land area in the Study Unit is agricultural, and 64 percent of the total area is cropland (fig. 2). Principal crops are wheat, barley, corn, and soybeans. Secondary crops include oats, sugar beets, sunflowers, potatoes, and forage grasses. Most nonagricultural land is along the eastern edge of the Study Unit.
Good quality water is important for residents in the Study Unit. In 1990, about 36 percent of the withdrawals from surface water in the basin were used for public supply (Stoner and others, 1993). Most of these withdrawals were from the Red River by Fargo and Grand Forks, North Dakota, and Moorhead, Minnesota, the major urban areas in the basin. Public supplies also came from ground water. In rural areas, water for domestic use was obtained almost exclusively from glacial sand and gravel aquifers. All public drinking water should meet standards to protect the health of the population and preferably have no objectionable taste or odor. Water use also can affect water quality. For example, irrigation, accounting for 47 percent of all 1990 water withdrawals (fig. 3), can increase leaching of salts and agricultural chemicals into shallow ground water.
Streamflow generally was above average during the 1993– 95 period of sampling. The spring peaks for 1993 and 1994 were generally within the 25th and 75th percentile of flow (fig. 4), and the peak for 1995 was above the 75th percentile of flow. Summer storms produced streamflows much larger than the 75th percentile in each of the sampling years, with the storms of 1993 resulting in very large flow. Large summer rainfalls can remove nutrients and pesticides applied after the spring snowmelt and result in larger than normal concentrations and loads of these constituents in streams. Spring peak flows can contain pesticides applied in the fall and nutrients leached from decaying matter and soils.
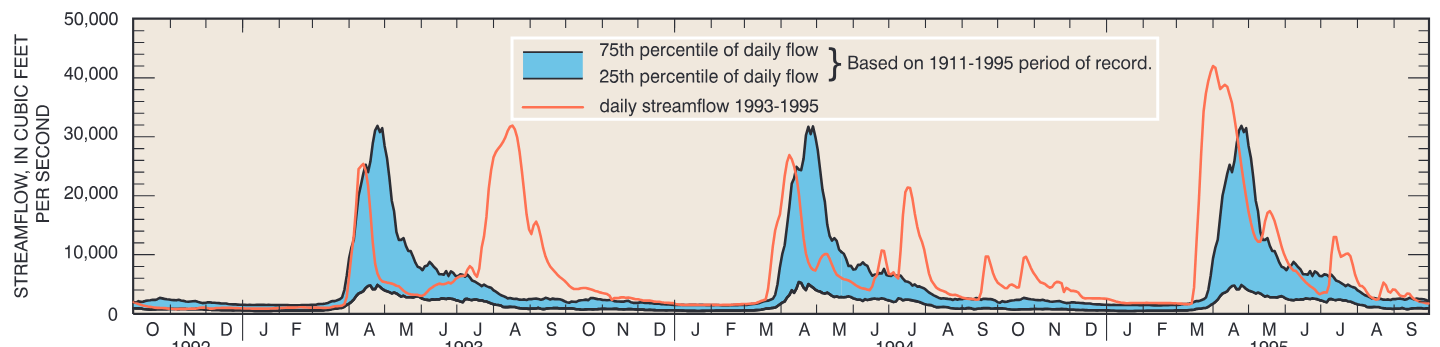
Figure 4. Daily streamflow in the Red River of the North at Emerson, Manitoba, shows above-normal flows during the study period.
In the Red River of the North Basin, 1993-95

Figure 3. Overall water use in 1990 generally was balanced between surface and ground-water sources.
Ground-water levels generally were high during the 1993–95 period of sampling. Drought conditions that lasted from 1987 into 1991 preceded this sampling. Ground-water levels generally rose from the end of the drought to the time of sampling as a result of increased recharge. This rise can be seen in the hydrograph for a well located in the southeast subregion (fig. 5). Recharge can affect the quality of shallow ground water. The quality of shallow ground water is affected by land-use activities and relatively recent (0–10 years) recharge. However, the quality of deeper ground water, which typically is older than 20 years, is less affected by relatively recent land-use activities and recharge.

Figure 5. Ground-water levels generally were high during the study period.
U.S. Geological Survey Circular 1169
MAJOR ISSUES AND FINDINGS (A) Background Water Quality
Defining background conditions of water quality is important for water and land managers in assessing the effects of human activities, such as land use, on water resources. The background dissolved solids in rivers and ground water in the Red River Basin Study Unit include the major cations (calcium, magnesium, sodium, and potassium), the major anions (bicarbonate, chloride, and sulfate), trace elements (including iron and manganese), and radionuclides (uranium, radium, and radon). The most common ions in ground water from surficial and buried glacial aquifers are calcium, magnesium, and bicarbonate, all of which are at fairly low concentrations. Median dissolved solids are about 400 milligrams per liter (mg/L) for surficial glacial aquifers and 500 mg/L for buried glacial aquifers. Common ions in deeper bedrock aquifers are sodium and chloride (the components of table salt) and are at much higher concentrations (median dissolved-solids concentration about 1,900 mg/L).
Ground-water studies in the Study Unit demonstrated that water quality in surficial aquifers in the west and central subregions is significantly different than that in the southeast subregion (Cowdery, in press). These differences are in the concentrations of dissolved solids, sodium, sulfate, silica, potassium, uranium, and radium. The west and central subregions have higher concentrations of all of these ions except radium, which is higher in the east. Variations in water quality are related to natural differences in geology and hydrology. Saline sedimentary bedrock aquifers exist mostly in the western part of the Study Unit (fig. 6). Most of the eastern part is underlain by crystalline rocks that do not readily transmit water and were not considered for this study. The sedimentary bedrock aquifers slope gently upward to the east, in the direction of regional ground-water flow. Saline water from these aquifers is primarily discharged in the north-central part of the Study Unit. Saline ground water from deep aquifers seeping into some shallow buried and
Water Quality in the Red River of the North Basin, Minnesota, North Dakota, and South Dakota, 1992–95 surficial aquifers in the west and central subregions can affect the quality and use of water in these aquifers. This saline ground water also can discharge into streams and degrade water quality in the northwestern part of the Study Unit. This effect can be greatest during periods of extremely low streamflow. Most water in the Red River Basin Study Unit is safe to drink according to U.S. Environmental Protection Agency (USEPA) standards for natural constituents (dissolved solids, major ions, and radionuclides).

Figure 6. Surficial aquifers are in glacial sediments throughout the Study Unit. Saline ground water in sedimentary rocks can seep to the land surface.
Some constituents of ground water in the Study Unit exceeded USEPA drinking-water standards (table1). These standards were exceeded in concentrations of primarily naturally occurring substances. Iron and manganese, which commonly occur in soluble minerals within glacial sediments, result in numerous exceedances of secondary maximum contaminant levels for these constituents in ground water. Radon concentrations were relatively consistent across the Study Unit. There is now no standard for radon in drinking water. USEPA withdrew the previous standard of 300 picocuris per liter (pCi/L) pending further review. More shallow ground water in the west and central subregions exceeds standards than does ground water in the southeast subregion (table 1). More water from buried sand and gravel aquifers exceeds standards than does water in surficial aquifers. In fact, more than 50 percent of the water in buried sand and gravel aquifers sampled exceeded the dissolved-solids standard and ranked among the highest nationally (p. 21). Although nitrate does occur naturally in ground water, background concentrations were not established in this study. Ground-water nitrate concentrations ranked among the lowest nationally (p. 20).
The distribution and concentration of major ions in streams appeared related to subregions in the Red River Basin Study

Dissolved solids, in mg/L Sodium, in mg/L Chloride, in mg/L Sulfate, in mg/L Sulfate, in mg/L Fluoride, in mg/L Iron, in mg/L Manganese, in mg/L Uranium, in mg/L
Radium, in mg/L Radon, in pCi/L U.S. Environmental Protection Agency standards and health advisories Glacial aquifer type Buried
0.005 Unit (Tornes and others, 1997). Historically, water in the Red River had mean dissolved-solids concentrations of 347 mg/L near the headwaters and 406 mg/L at the international boundary near Emerson, Manitoba (Stoner and others, 1993). The median dissolved-solids concentration at Emerson, Manitoba, was 419 mg/L during 1993–95 (Tornes and others, 1997), a period of relatively high streamflow conditions. With limited area of undisturbed land in the Red River Basin Study Unit, background conditions in stream-water quality were not definable.
Fish communities and stream habitat can be indicators of overall stream quality. For example, greater fish species diversity and abundance coincide with higher quality streams. Fish diversity and abundance in the streams of the Study Unit are influenced by human and natural factors (Goldstein and others, 1996b). Three factors explain about 60 percent of the variability in fish distribution: (1) the abundance and diversity of fish habitat within a stream, (2) the variability in the amount of water in the stream, and (3) the amount of relatively undisturbed land (forest or wetland) within about a mile of a stream. Habitat and stream variability are mostly natural factors, although both are influenced by human activities. Other factors considered in this study, such as number of dams, amount of drainage ditches, or width of riparian buffer zones, appear to have less effect on variability in fish distribution and abundance (Goldstein and others, 1996b). Percentage of ground-water samples exceeding standard or advisory
U.S. Geological Survey Circular 1169
MAJOR ISSUES AND FINDINGS (A) Background Water Quality
Subregion West Central Southeast
MAJOR ISSUES AND FINDINGS (B) Agriculture and Water Quality
This study focused on the relation between land use and water quality. Agriculture, and particularly crop production, is the primary use of land in the Red River Basin Study Unit. Streams and surficial sand and gravel aquifers are vulnerable to the effects of agricultural activities. These resources are important for public and commercial uses.
Nutrients detected in streams and pesticides detected in streams and water in surficial aquifers did not exceed any existing drinking-water standards and, except for a single instance for triallate, were not toxic to aquatic life.
A single sample from the Snake River (fig. 2) contained a triallate concentration of 0.28 microgram per liter (μg/L), which exceeded the interim Canadian guidelines for the protection of freshwater aquatic life (Canadian Council of Ministers of the Environment, 1992). Twenty-seven percent of the ground water sampled in the west subregion and 8 percent of the ground water in the southeast subregion exceeded the 10-mg/L drinking-water standard for nitrate (Cowdery, in press). None of the ground water in the central subregion exceeded the drinking-water standard for nitrate. Currently (1998), USEPA drinking-water standards exist for 7 of the 44 pesticides detected in the basin. No ground water exceeded any of the existing standards. Pesticide and nutrient persistence and regional differences in soils, geology, and climate govern the distribution of these water-quality indicators in the Red River Basin Study Unit (Tornes and others, 1997; Cowdery, 1997; and Cowdery, in press). Data from this study

Table 2. Water quality varies by major subregions in the Red River Basin Study Unit [SW, surface water; GW, ground water (surficial aquifers); --, not sampled; μg/L, micrograms per liter; mg/L, milligrams per liter; <, less than]
Nutrients (mg/L)
Median Index of Biotic Integrity
Water Quality in the Red River of the North Basin, Minnesota, North Dakota, and South Dakota, 1992–95 Median total nitrogen
Median total phosphorus Median orthophosphate (dissolved) West Water resource SW 0.36
-- and previous studies were not sufficient to determine changes in pesticide levels over time. Continued monitoring might help to satisfy concerns about pesticide trends in water.
Streams draining areas of extensive cropland (central and southern parts of the Study Unit) had the highest concentrations of nutrients (dissolved phosphorus, nitrate, and organic nitrogen) and the most detections of herbicides (Tornes and others, 1997). No stream water exceeded any of the existing drinking-water standards for pesticides or nutrients.
Table 2 shows that selected indicators of water quality varied across the four subregions, which generally relate to major categories of land use (fig. 2). The water-quality indicators used are commonly associated with agricultural land use but are also affected by environmental conditions, such as geology, soils, climate and hydrology.
Pesticide concentrations in water are not related only to amounts used in agriculture.
Despite having a drainage area composed of 64 percent cropland, the Red River delivered relatively low concentrations and loads of pesticides into Canada (table 3). Pesticide concentrations in water commonly were related to the drainage of water over and through agricultural soils, pesticide uptake by plants and microbes, and attachment to soil particles.
<.05 Remarks or specific findings
.02 Annual rate of Pesticide application (1990) Atrazine Triallate 2,4-D 1,700,000
The most heavily applied pesticides (2,4-D, MCPA, bromoxynil, and trifluralin) were not always the most frequently detected in streams and shallow aquifers (fig. 7 and tables 6 and 7, p. 24–26) (Tornes and others, 1997; Cowdery, in press). The infrequency of 2,4-D detection may be related to factors such as the following: (1) 2,4-D is applied as a postemergent herbicide and mostly is taken up by plants where it is metabolized to other compounds, (2) soil microbes effectively degrade 2,4-D, or (3) soils retain 2,4-D instead of allowing it to run off or seep downward into ground water (Tornes and others, 1997). Triallate was detected in northern streams of the Study Unit, an area where it is most commonly applied to small grains. Triallate usually was applied during autumn and reached streams during spring snowmelt runoff. 120,000 450,000 Load at Emerson Percent (1993–95) output 1,100 0.9 .06 .02
MAJOR ISSUES AND FINDINGS (B) Agriculture and Water Quality

Figure 7. More pesticides were detected in streams than in shallow surficial ground water, and most were herbicides.
Some pesticides were ubiquitous.
Atrazine, applied on corn mostly in the southern part of the basin, and its metabolite, deethylatrazine, were the most frequently detected pesticides in streams throughout the basin and shallow ground water beneath cropland. Atrazine was detected in nearly every stream sample collected from the basin, even during winter. Simazine, commonly applied for weed control in rights-of-way in the Study Unit, also was detected frequently in streams and shallow ground water. Although DDT was banned for use in the United States more than 20 years ago, low concentrations of DDT and its metabolites were detected in stream sediments and fish tissues (Goldstein and others, 1996a; Brigham and others, 1996). The metabolite p,p'-DDE was detected in some ground water and streams. DDT and its metabolites are more prevalent in agricultural areas, indicating that residue from past DDT use is a more prevalent source than atmospheric transport from distant sources (outside of the Red River Basin Study Unit).
U.S. Geological Survey Circular 1169
MAJOR ISSUES AND FINDINGS (B) Agriculture and Water Quality

Figure 8. Cropland applications of nitrogen and phosphorus have contributed nutrients to streams (1993-95).
Cropland activity has contributed to nutrients found in overlying sediments, indicated no significant contamination streams and shallow ground water. from irrigation (Cowdery, in press).
Nutrient concentrations were relatively low, but cropland activity has increased the amount of nutrients (particularly phosphorus) available to aquatic plants in streams (fig. 8). Phosphorus concentrations occasionally were high enough to produce eutrophic conditions in streams and receiving waters, such as lakes and wetlands. For example, streams draining the western and central parts of the basin (mostly cropland) had the highest concentrations of total phosphorus—0.12 to 0.32 mg/L. Streams draining the eastern part of the basin (where the percent cropland is smaller) had the lowest total phosphorus concentrations—0.08 mg/L or less. Concentrations of dissolved and suspended phosphorus increased substantially during runoff after snowmelt and rainfall. High phosphorus concentrations in the Pembina River probably resulted from agricultural applications and naturally occurring phosphorus in soils that is readily delivered to this river because of steep terrain in the watershed. From 1975 to 1988, 60 percent of the phosphorus load to Lake Winnipeg by the Red River came from the U.S. portion of the Red River Basin (Brigham and others, 1996).

Figure 9. Nitrate concentration in streams differed by subregion in the Study Unit.
The median concentration of nitrate was higher in the Red River than in the tributaries (fig. 9). These values indicate that activities in and near the Red River are contributing to the nitrate concentrations in the river. These activities could be both agricultural and nonagricultural.
Generally, water in aquifers sampled for the Red River Basin Study Unit is safe to drink relative to nutrients and herbicides (Cowdery, in press) (fig. 10). As related to agricultural pesticide application, volatile organic compounds (VOCs) were not detected in surficial aquifers (Cowdery, 1997; Cowdery, in press). Concentrations of pesticides and nutrients in water from the buried aquifers, naturally protected by

Figure 10. Agricultural chemical concentrations in ground water differed by subregion in the Study Unit.
Water Quality in the Red River of the North Basin, Minnesota, North Dakota, and South Dakota, 1992–95 Detections of pesticides and nitrate in shallow ground water were related to cropland in sandy soils over coarsetextured aquifers.
Nitrate concentrations near the water table exceeded the drinking-water standard (10 mg/L) in some areas but decreased significantly at greater depths in the surficial aquifers (Cowdery, 1997). Irrigation has enhanced crop production in some areas by allowing for increased yields and a greater variety of crops. Increased applications of fertilizer and pesticides are sometimes associated with irrigation. Irrigation has also been associated with pesticides and nutrients reaching parts of some surficial aquifers. The concentrations of pesticides in shallow ground water in the irrigated parts of the Otter Tail outwash aquifer (fig. 11) are higher than elsewhere in the Study Unit and indicate the potential for contamination in deeper ground water (Cowdery, 1997).

Figure 11. Several sites of possible stream-aquifer interaction occur in the Red River of the North Basin Study Unit.
A detailed study of the Otter Tail outwash aquifer (see page
22) that included analyses of ground-water age, water chem-
istry, and historical land use showed a trend of increased nitrate and nitrogen levels over the past 30 years (Stoner and others, 1997). The combination of irrigation, sandy soils, aquifer materials with low carbon content, and conditions not favorable for biological reduction of nitrate resulted in elevated nitrate in the shallow ground water.
The Otter Tail outwash aquifer, with high nitrate concentrations near the water table, discharged water with low nitrate concentrations to the Otter Tail River, according to one intensive case study (Puckett and others, 1995; Tornes and others, 1996; Stoner and others, 1997). Mixing with older, low-nitrate ground water and denitrification (whereby nitrate was transformed to nitrogen gas and removed from the water) as water flowed beneath riparian wetlands accounted for the low concentrations of nitrate discharging to the river. These conditions helped reduce the possibility of eutrophica-
MAJOR ISSUES AND FINDINGS (B) Agriculture and Water Quality
tion in the river and downstream lakes and wetlands. Figure 11 shows other areas in the Study Unit where surficial aquifers potentially discharge water to streams.
A direct link between pesticides and nutrients in streams and fish communities was not established.
Fish were studied as part of the overall assessment of stream quality. Detailed analysis showed that both chemical and physical factors affect the composition of fish communities in the streams of the Study Unit. Specific cause-and-effect relations could not be established, however. Differences in fish communities could not be explained directly by differences in concentrations of nutrients and pesticides in streams in agricultural areas (Goldstein and others, 1996b). Only one pesticide (triallate) was detected in one stream sample that exceeded a level of concern for acute toxicity to aquatic organisms (Tornes and others, 1997). More work will be helpful to better assess the effects of nutrients on the aquatic food chain and the effects of pesticides on the reproductive abilities of fish (Goodbred and others, 1997).
Limitations of this assessment of agriculture and water quality should be recognized.
Some insecticides and most fungicides applied to specialty crops, such as potatoes and sugar beets, were not analyzed in this study; also, the results of this water-quality assessment likely were affected by the unusually wet summers that occurred during the period of intensive sampling (1993–95). Dilution or increased loads to streams or surficial aquifers were possible as a result of these wet conditions. Therefore, the relation established between agriculture and water quality during this study may not represent average conditions.
Fish distribution and abundance may not be a good indicator of nutrient effects on stream quality. Most of the nutrients enter the stream early in the spring when temperatures are low and most metabolic rates for aquatic plants and animals likewise are low. Therefore, the amount of nutrients applied in a watershed correlated poorly with fish distribution and abundance.
Currently (1998), drinking-water standards are set only for individual pesticides. However, pesticides commonly occur in mixtures of up to nine compounds in surface water that is a potential source of drinking water. Although most shallow ground water did not contain detectable concentrations of pesticides, more than one pesticide commonly was detected in water where there were detectable concentrations. The health effects of such combinations of pesticides in drinking water are not well understood. However, the effects of various pesticides on human health may differ when pesticides are present in combination, even at low concentrations, in drinking water. The USEPA (1994) is considering establishing drinking-water standards for combinations of triazine pesticides and their individual degradation products.
U.S. Geological Survey Circular 1169
MAJOR ISSUES AND FINDINGS (C) Red River Water Quality and Nonagricultural Sources of Contamination
Although the major land use in the basin is agriculture, urban areas also can affect water quality. The primary sources of contamination from urban areas are stormwater runoff, municipal wastewater discharge, and industrial discharge. This study did not focus specifically on point discharges; but generally, water quality downstream from Fargo can be compared to the water quality upstream.
The concentrations of some indicators of nutrient contamination were slightly but measurably higher downstream from Fargo, North Dakota, and Moorhead, Minnesota, than upstream (Tornes and others, 1997).
The median concentrations of ammonia and total phosphorus were slightly higher in the Red River downstream from the Fargo-Moorhead area (fig. 12). This analysis was based on the discharge-weighted mean concentration of ammonia and total phosphorus upstream from the Fargo-Moorhead area and at Halstad (fig. 2).

Figure 12. Ammonia and phosphorus concentrations in the Red River of the North increase in a downstream direction through the Fargo-Moorhead area.
The effect of municipal wastewater discharges on the total nitrogen concentration can be estimated through a mass balance model. In this model, the total nitrogen concentration is computed from the concentration in the average daily municipal wastewater-treatment outflow and the concentration in streamflow at the time of measurement. Adding the municipal wastewater outflow from Fargo and Moorhead increases the median total nitrogen concentration from 1.41 mg/L upstream from the Fargo-Moorhead area to 1.68 mg/L downstream (Tornes and others, 1997). The effect on the Red River is difficult to assess farther downstream because the streamflow nearly doubles between the Fargo-Moorhead area and Halstad, Minnesota. This analysis assumes a total nitrogen concentration of 11.2 mg/L for sewage effluent (national average, Larry Puckett, U.S. Geological Survey, written commun., 1993). This model may not be appropriate for conditions after September 1995 because a new sewagetreatment plant went into full service at that time.
Water Quality in the Red River of the North Basin, Minnesota, North Dakota, and South Dakota, 1992–95 Nitrite plus nitrate concentrations tended to be slightly higher than historical concentrations at sites along the Red River. Median ammonia concentrations for the Red River at Halstad, downstream from the Fargo-Moorhead urban area, were about 0.16 mg/L in historical samples, but were only 0.08 mg/L in samples collected for this study (Tornes and others, 1997). Increases in nitrate and decreases in ammonia have been identified in several streams nationwide, particularly downstream from urban areas; these trends likely reflect improved aeration of wastewater effluent, whereby ammonia is nitrified to nitrate. It also is possible that reduced loading of oxygen-demanding materials is allowing streams to remain aerated, decreasing the instream production of ammonia.
Although urban areas contribute only a portion of the phosphorus in the Red River (fig. 12), it is a major issue in Red River water quality. Eutrophication due to high concentrations of phosphorus is possible in streams and in Lake Winnipeg, into which the Red River flows (fig. 1). Noxious algal blooms have occurred frequently in Lake Winnipeg (Nielsen and others, 1996). From 1969 to 1974, the Red River contributed about 58 percent of the total phosphorus but only 9 percent of the total flow to Lake Winnipeg (Brunskill and others, 1980). More recently, from 1975 to 1988 the Red River contributed, on average, twice the phosphorus load but only one-fifth the flow of the Winnipeg River (the other major tributary to the southern part of Lake Winnipeg); furthermore, about 60 percent of the phosphorus load at the outflow of the Red River comes from the U.S. portion of the Red River Basin (Brigham and others, 1996). Fish tissues, streambed sediments, and water in shallow aquifers were examined for potentially toxic chemicals. Many of the chemicals are associated with modern industrial sources, which are relatively sparse in the largely rural Red River Basin Study Unit.
PCBs are a class of industrial compounds that have been banned in the United States because of their toxicity and persistence in the environment. PCBs are synthetic so there are no natural or background levels of these compounds. Atmospheric transport of mercury, PCBs, and PAHs may carry these contaminants far from their sources (reviewed by Brigham and others, 1998). VOCs include both synthetic chlorinated compounds and compounds of natural origin, such as components of petroleum. These compounds have been widely dispersed in the environment by human activity.
Many of the contaminants detected in the Study Unit are present in aquatic ecosystems worldwide. Mercury and PAHs occur naturally but also are released to the environment from industrial activities such as fossil-fuel combustion and garbage incineration (table 4).
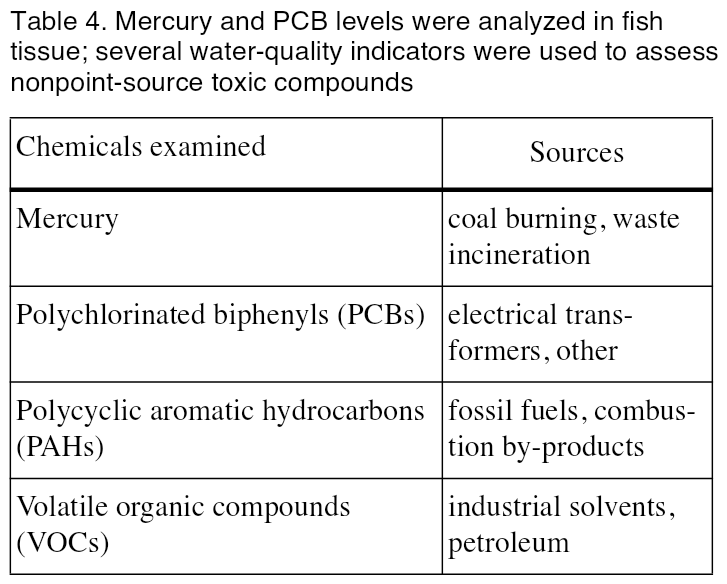
Polychlorinated biphenyls (PCBs) electrical trans-
Polycyclic aromatic hydrocarbons (PAHs)
Volatile organic compounds (VOCs)
Medium-sized carp (about 2–4 pounds) in the Red River had an average mercury concentration of 0.31 part per million (ppm) in the muscle (fillet) tissue. Smaller channel catfish (about 0.5–1 pound) had lower mercury levels, averaging 0.18 ppm (Goldstein and others, 1996a). These concentrations are in the moderate range of Minnesota’s fish-consumption guidelines. Although fish from this study had mercury concentrations lower than the U.S. Food and Drug Administration’s 1-ppm standard, larger catfish and other game fish from the Study Unit analyzed by the Minnesota Department of Natural Resources (1994) exceeded this standard.
Polychlorinated biphenyls were commonly detected in low concentrations in fish samples.
(D) Effects of other Nonpoint-Source Toxic Compounds on Water Quality
coal burning, waste incineration
fossil fuels, combustion by-products
MAJOR ISSUES AND FINDINGS
Few fish samples had PCB levels in the moderate range of fish-consumption guidelines (Brigham and others, 1998).
Polycyclic aromatic hydrocarbons were widely detected in bed sediments.
Bed sediment samples at few sites had PAH levels that were potentially high enough to adversely affect aquatic organisms, based on published toxicity studies (reviewed in Brigham and others, 1998). See tables 8 and 9, p. 27–29, for specific PAH and other semivolatile organic compounds detected and their range of concentration.
Volatile organic compounds were rarely detected in shallow ground water and when detected were at concentrations well below USEPA drinking-water standards.
VOCs were sampled in shallow ground water mostly beneath agricultural areas and under ice conditions in the Red River. Most VOC concentrations were below detection limits. Compounds that are in gasoline were detected in one well. It is possible that the well was contaminated during construction, and that sample might not be representative of the ground water in the aquifer (Cowdery, 1997).
U.S. Geological Survey Circular 1169
MAJOR ISSUES AND FINDINGS (E) Sediment in Streams “The presence of sediment is one of the most obvious characteristics of small streams. Sediment has several forms and sources, but of greatest concern in stream and river sediment problems are the fine inorganic particles that either flow with the current (causing turbidity) or that are deposited on the streambed (causing loss of benthic productivity and fish habitat). Such sediment is widespread and pervasive, occurring to some extent in all streams.”—Thomas F. Waters (1995)
“Obvious effects of ... anthropogenic erosion and sediment deposition include loss of agricultural soils, decreased water-retention capacity of forest lands, increased flood frequency, and rapid filling of reservoirs. Less obvious, however (and until recently largely ignored), is sedimentation in small streams that affects biotic communities, reduces diversity of fish and other animal communities, and lowers the productivity of aquatic populations.” —Thomas F. Waters (1995)
Water Quality in the Red River of the North Basin, Minnesota, North Dakota, and South Dakota, 1992–95 Water in the Red River is turbid, resulting from the fine suspended sediments (clay and silt). Suspended-sediment concentrations vary greatly in streams in the Study Unit due to factors such as landscape characteristics, streamflow, season, and land use. High suspended-sediment concentrations characterize streams that flow through heavily cropped, erodible lands (especially in the central part of the Study Unit) and erodible stream channels (especially the Pembina River). In contrast, low sediment concentrations characterize most streams that drain upland areas of the Study Unit. Most of these streams flow through reservoirs, lakes, and wetlands. Suspended sediments settle in these quiescent waters.
Suspended sediment in streams affects the chemical water quality. At high sediment concentrations, a significant portion of phosphorus and nitrogen in streams is attached to sediment. Organochlorines such as DDT and PCBs, and trace elements such as mercury and lead, adhere tightly to sediments, which can settle to the bottom of streams, lakes, and reservoirs. Organochlorines and trace elements were found in bed sediments during this study (Brigham and others, 1998) (see also tables 8 and 9, p. 27–29).
High sediment concentrations also diminish the esthetic water quality. The enjoyment of recreational activities such as fishing, swimming, and boating can be affected by sediment in the stream.
The highest sediment concentrations in each stream typically accompanied high flows (fig. 13). Therefore, sediment concentrations in streams are highest in the spring or after heavy summer rains.
MAJOR ISSUES AND FINDINGS (E) Sediment in Streams

Figure 13. The Pembina River at Walhalla, North Dakota, had the highest suspended-sediment concentrations in all of the sampled streams. At the highest concentration, the river was carrying about 30,000 tons of sediment per day. The Snake River near Alvarado, Minnesota, is typical of central subregion streams.
Land-use practices that do not abate rapid runoff of water can impair water quality by increasing suspended sediment in streams in two ways.
First, runoff erodes bare soils, which contributes sediment to streams. Second, higher streamflows associated with runoff events will more readily erode sediments from the channel and streambanks. The relative importance of these two sources of sediment is unknown for streams in the Red River Basin Study Unit.
U.S. Geological Survey Circular 1169
MAJOR ISSUES AND FINDINGS (F) Importance of Variations in Water Quality
Water-quality criteria and indicators used for monitoring and overall management of contamination sources for water resources in this basin could be enhanced by considering the water-quality effects of variation by subregion, hydrologic conditions, and season.
Nitrate concentrations in streams tended to be highest in the central subregion of the Study Unit (Tornes and others, 1997) where fertilizer application was the greatest (Tornes and Brigham, 1994). Total phosphorus also was higher in the central subregion than in the other subregions (Tornes and others, 1997). Atrazine and associated herbicides were detected mostly in the southern part of the basin where corn is a major crop. Streams in the western subregion had the highest concentrations of sulfate and usually the highest concentrations of dissolved solids. Dissolved-solids concentrations ranged from 300 mg/L in the upper Otter Tail River to about 800 mg/L in the Bois de Sioux River (Tornes and others, 1997).
This study was conducted during a period of relatively wet hydrologic conditions. These wet conditions enabled some definition of water quality during high streamflows and ground-water recharge. However, without comparable historical data, the specific effects of these wet conditions cannot be quantified.
Much of the temporal variation in water quality is seasonal. Seasonally, winter brings cold temperatures, snow, and ice. Surface waters tend to have less dissolved oxygen, lower concentrations of suspended sediment, and higher concentrations of nutrients than during other seasons. Ammonia and dissolved phosphorus concentrations can be high under ice conditions. Typical concentration of dissolved oxygen under ice was 0.1 mg/L in the Red River (Tornes and others, 1997).
Spring brings cool temperatures, melting snow and ice, flooded fields, and high flows in rivers with corresponding increases in dissolved-oxygen, suspended-sediment, and nutrient concentrations. Snowmelt and precipitation runoff delivers nutrients, pesticides, and sediment to streams. Soil preparation and the application of chemicals relative to the occurrence of precipitation accounts for some of the variability in the amount of contaminants that reached Study Unit streams. Agricultural chemicals such as triallate, a herbicide applied in the fall, may reach their highest concentrations during spring (Tornes and Brigham, 1995) (fig. 14).
Summer brings warm temperatures, thunderstorms, and generally declining water levels in rivers. The periodic rainstorms increase suspended sediment and transport pesticides applied in spring and summer to surface waters.
Water Quality in the Red River of the North Basin, Minnesota, North Dakota, and South Dakota, 1992–95 Fall brings cool temperatures, falling leaves, and low stream-water levels. Streamflows approach the annual minimum during fall (Stoner and others, 1993). Reduced flows generally correspond to reduced suspended-sediment, nutrient, and pesticide concentrations.

Figure 14. The concentration of pesticides in the Red River depends on the timing of their application and runoff from rainstorms or snowmelt.
Detailed studies of cropland effects on the quality of water in shallow surficial aquifers (Otter Tail and Sheyenne Delta study areas, p. 22) showed significant differences in pesticide presence and nitrate concentrations with location, season, and depth (Cowdery, 1997).
The median nitrate concentrations in ground water from the Otter Tail study were higher than from the Sheyenne Delta study: 6.1 mg/L compared to 0.03 mg/L, respectively. More pesticides were detected for the Otter Tail study and at higher concentrations than for the Sheyenne Delta study. The water-quality difference was related to differences in total nitrogen application to cropland (estimated at 52 and 23 pounds per acre per year, respectively) and slight differences in hydrologic and soil conditions among the aquifer settings. Although land use in both areas was similar, the Otter Tail aquifer received more recharge because of coarser textured soils and generally more irrigation.
Seasonal differences in nitrate concentrations in the upper 5 to 10 feet of these surficial aquifers were related in part to the timing of significant recharge periods that generally coincided with spring snowmelt and major summer rainstorms. This variable recharge, in conjunction with variations in the timing and application of fertilizer applied to each crop, results in complex changes in nitrate concentrations over time in shallow depths in these aquifers (fig. 15). Similar temporal variability in pesticide presence also might be expected. This information could be used in the design of ground-water monitoring of surficial aquifers for the purpose of checking the progress of land-management practices. Many privately owned drinking-water wells used in the Otter Tail and Sheyenne Delta aquifers are deeper than the monitoring wells from this study and produced water that was safe to drink. Water quality near the water table was affected by the land-use activities because of relatively recent recharge (1 to 10 years). The quality of the deeper ground water was older (greater than 20 years) and was therefore less affected by the relatively recent land-use practices and recharge (Stoner and others, 1997, and fig. 16).

Figure 15. At shallow depth in surficial aquifers, nitrate concentrations sometimes varied with season.

Figure 16. Ground-water monitoring that considers the use of wells completed near the water table could provide resource managers better opportunities to effect change in land-use practices before contamination spreads wider and deeper into an aquifer.
Fish community composition correlated well with stream size, habitat availability, and hydrologic variability, but not with geographic provinces and ecoregions (Goldstein and others, 1996b). Species in small streams, medium streams, and large rivers tend to differ (fig. 17). The source of species for tributary streams was the Red River, so any given species has potential access to most tributaries. The number of fish species (one measure of community health) increased with
MAJOR ISSUES AND FINDINGS (F) Importance of Variations in Water Quality
the size of streams and the number of ecoregions through which a stream flowed (Goldstein, 1995). Approximately 60 percent of the variability in fish community composition can be attributed to factors such as habitat, streamflow, water temperature, minimum dissolved-oxygen concentration, nutrients, and suspended sediment (Goldstein and others, 1996b). Additional variation was due to both human influence from land-use practices and biological interactions (competition, predation, disease, and parasitism) (Goldstein and others, 1996b). No patterns could be found to interpret cause-and-effect relations. Biological communities have adapted to take advantage of the environmental conditions that occur during each season: increased habitat volume and dissolved-oxygen concentrations during the spring for reproduction; increased water temperatures and productivity during summer for growth; lower water levels during fall for concentration of prey; and reduced activity and return to deep-water refuges during low water and dissolved-oxygen concentrations in winter (Goldstein and others, 1996b). A biological monitoring program (Niemela and others, in press) that relies on periodically sampling communities under the same seasonal environmental conditions has been developed for the Red River Basin Study Unit.

Figure 17. Fish species composition changes with stream size.
U.S. Geological Survey Circular 1169
WATER-QUALITY CONDITIONS IN A NATIONAL CONTEXT Comparison of Stream Quality in the Red River of the North Basin with Nationwide NAWQA Findings


ORGANOCHLORINE PESTICIDES and PCBs in stream bed sediment and biological tissue
Water Quality in the Red River of the North Basin, Minnesota, North Dakota, and South Dakota, 1992–95 Seven major water-quality characteristics were evaluated for stream sites in each NAWQA Study Unit. Summary scores for each characteristic were computed for all sites that had adequate data. Scores for each site in the Red River of the North Basin were compared with scores for all sites sampled in the 20 NAWQA Study Units during 1992–95. Results are summarized by percentiles; higher percentile values generally indicate poorer quality compared with other NAWQA sites. Water-quality conditions at each site also are compared to established criteria for protection of aquatic life. Applicable criteria are limited to nutrients and pesticides in water, and semivolatile organic compounds, organochlorine pesticides, and PCBs in sediments. (Methods used to compute rankings and evaluate aquatic-life criteria are described by Gilliom and others, in press.) Pesticide concentrations in the Red River and its tributaries are lower than most concentrations in streams from other NAWQA Study Units. The Study Unit had the highest percentage of agricultural cropland among other Study Units and is in the lowest quartile in terms of pesticide concentrations. Where detected, DDT concentrations were typical of other minimally contaminated areas in the other NAWQA Study Units. Organochlorine concentrations in fish usually were low in the Study Unit and were low on a national basis. However, PCB concentrations in some fish from this area prompt State fish-consumption advisories. PCBs and many organochlorine compounds were banned in the 1970’s. Nearly all streams that drain the eastern parts of the Study Unit contained nutrient concentrations that were lower than the national median for the other Study Units. Streams that drain the western and central areas were higher than the national median. The distribution of cropland and soils helps explain this nutrient pattern.


WATER-QUALITY CONDITIONS IN A NATIONAL CONTEXT Comparison of Stream Quality in the Red River of the North Basin with Nationwide NAWQA Findings

Trace elements in sediments were usually typical of other NAWQA Study Units and reflect natural concentrations. The site with the highest concentrations likely reflects higher natural concentrations of trace elements associated with shale outcroppings in that area.
This broad group of chemicals includes PAHs (polycyclic aromatic hydrocarbons, which are both components of fossil fuels and by-products of combustion), phenols (industrial solvents), and phthalates (often used as plasticizers or solvents). concentrations of these compounds were below the median of other NAWQA Study Units.

Stream habitat in the basin was generally poor compared to the other NAWQA Study Units. Almost all streams in the basin have been modified through dams, ditching, or channelization and erosion due to unstable banks. Agricultural practices that leave riverine wetlands and intact riparian zones with naturally dense vegetation seem to provide a degree of instream habitat protection and enhance fish communities.

Compared to other NAQWA Study Units, fish species composition varied from poor to good, depending on area within the basin. Tributary streams outside of the central subregion tended to have better composition of species. Tributary streams in the central subregion and the Red River were dominated by introduced carp but still contained numerous species. It is difficult to distinguish the relative importance of natural compared to land-use factors due to the interactions where land use affects habitat and water quality.
U.S. Geological Survey Circular 1169

CONCLUSIONS The significant amount of cropland in the Red River Basin Study Unit has resulted in elevated concentrations of nutrients and low concentrations of pesticides in many streams. However, comparison to the NAWQA sites nationwide shows that nutrient concentrations were not exceptionally high and pesticide detections were relatively low.
The presence of other toxic compounds in bed sediments or fish tissue were typical of other areas nationally. Aquatic-life criteria were not exceeded.
The distribution of trace elements is mostly affected by geology. Fish communities and habitat are relatively poor and are related both to natural conditions and land-use practices. WATER-QUALITY CONDITIONS IN A NATIONAL CONTEXT Comparison of Ground-Water Quality in the Red River of the North Basin with Nationwide NAWQA Findings


Water Quality in the Red River of the North Basin, Minnesota, North Dakota, and South Dakota, 1992–95 Five major water-quality characteristics were evaluated for ground-water studies in each NAWQA Study Unit. Ground-water resources were divided into two categories: (1) drinking-water aquifers, and (2) shallow ground water underlying agricultural or urban areas. Summary scores were computed for each characteristic for all aquifers and shallow ground-water areas that had adequate data. Scores for each aquifer and shallow ground-water area in the Red River of the North Basin were compared with scores for all aquifers and shallow ground-water areas sampled in the 20 NAWQA Study Units during 1992–95. Results are summarized by percentiles; higher percentile values generally indicate poorer quality compared with other NAWQA ground-water studies. Water-quality conditions for each drinking-water aquifer also are compared to established drinking-water standards and criteria for protection of human health. (Methods used to compute rankings and evaluate standards and criteria are described by Gilliom and others, in press.)
All radon concentrations ranked in the lower 50 percent of the samples collected from other NAWQA Study Units. Currently (1998), there are no Federal drinking-water standards for radon. The historical standard was exceeded in two-thirds and one-half of the samples collected from the surficial and buried aquifers, respectively.
Although nitrate concentrations generally were low in comparison to other Study Units, the variability of nitrate concentrations was high. This explains why 27, 8, and 6 percent of the samples from the western and southeastern surficial aquifers and the buried aquifers, respectively, exceeded the USEPA drinking-water standard, whereas a much larger percentage of samples from these aquifers had concentrations close to or below detection limits. Nitrate concentrations in shallow ground water of the Otter Tail Outwash agricultural area ranked in the upper 50 percent among other Study Units.
Comparison of Ground-Water Quality in the Red River of the North Basin with Nationwide NAWQA Findings


CONCLUSIONS
Given the large area of agricultural cropland in the Red River Basin Study Unit, pesticide detections and nitrate concentrations in ground water were relatively low compared to the other NAWQA Study Units.
For the Otter Tail outwash area, where sandy soils over relatively permeable surficial aquifers have been irrigated to enhance crop production, shallow ground water has been contaminated with pesticides and nitrate. These results show the
Of the two areas studied, VOCs were detected in only one well (Sheyenne Delta agricultural area), placing the Study Unit among the lowest compared to other NAWQA Study Units for VOC detections.
WATER-QUALITY CONDITIONS IN A NATIONAL CONTEXT
Dissolved-solids concentrations ranked in the upper 50 percent of the samples collected from other NAWQA Study Units. These concentrations were highest in the surficial aquifers located in the western and central subregions and in the buried aquifers sampled. These dissolved-solids concentrations, which largely reflect the effect of geology and semiarid climate, exceeded the drinking-water standard in more than one-third of the ground water sampled basin wide and from 14 to 17 percent of the shallow ground water sampled in the two agricultural areas studied.

importance of considering the geology along with agricultural and water-management practices in protecting ground-water quality.
The geology and semiarid climate of the western part of the basin result in dissolved-solids concentrations that are among the highest in the NAWQA Study Units. However, these concentrations are not a serious health risk for drinking water. They can result in esthetic nuisances, such as scale buildup, staining, and unpleasant taste.
U.S. Geological Survey Circular 1169
STUDY DESIGN AND DATA COLLECTION In the Red River of the North Basin, 1992-95
The ground-water studies assessed the overall water quality of surficial aquifers and buried glacial aquifers (table 5). Land-use effects on ground-water quality were also described in two study areas. A special study addressed land-use effects on the Otter Tail outwash aquifer along ground-water flow from areas of recharge beneath the land use to an area of discharge to a stream.
Aquatic biology sites were selected to describe the variation among the USEPA ecological regions (Omernik, 1987) in the Study Unit (table 5). Samples were also taken to determine the presence of contaminants in fish tissue.
Water Quality in the Red River of the North Basin, Minnesota, North Dakota, and South Dakota, 1992–95 The stream-water-quality sampling design (table 5) was established to assess the effects of agricultural land use on water quality and account for differences in the four subregions. A special study addressed the capacity of suspended sediment for transporting nutrients in streams.
STUDY DESIGN AND DATA COLLECTION In the Red River of the North Basin, 1992-95
U.S. Geological Survey Circular 1169
SUMMARY OF COMPOUND DETECTIONS AND CONCENTRATIONS
The following tables summarize data collected for NAWQA studies from 1992–95 by showing results for the Red River Basin Study Unit compared to the NAWQA national range for each compound detected. The data were collected at a wide variety of places and times. In order to represent the wide concentration ranges observed among Study Units, logarithmic scales are used to emphasize the general magnitude of concentrations (such as 10, 100, or 1000), rather than the precise number. The complete dataset used to construct these tables is available upon request. The statistics for detection rates reported in Table 6 can differ from those reported in Figure 7 because of differing definitions of detection limits.


Alachlor (Lasso) 2,6-Diethylaniline (metabolite) Atrazine (AAtrex) Desethylatrazinec (metabolite) Bentazon (Basagran) Bromoxynil (Buctril) Cyanazine (Bladex) 2,4-D (Butyrac) DCPA (Dacthal) Dicamba (Banvel) Dichlorprop (Kildip) Diuron (Karmex, Direx) EPTC (Eptam)
Water Quality in the Red River of the North Basin, Minnesota, North Dakota, and South Dakota 1992-95
SUMMARY OF COMPOUND DETECTIONS AND CONCENTRATIONS

Chloroethene (vinyl chloride) Dimethylbenzenes (total xylenes) Ethenylbenzene (styrene) Ethylbenzene (phenylethane) Isopropylbenzene (cumene) Methylbenzene (toluene) Naphthalene n-Butylbenzene (1-phenylbutane) n-Propylbenzene (isocumene)


U.S. Geological Survey Circular 1169
SUMMARY OF COMPOUND DETECTIONS AND CONCENTRATIONS
Water Quality in the Red River of the North Basin, Minnesota, North Dakota, and South Dakota 1992-95
SUMMARY OF COMPOUND DETECTIONS AND CONCENTRATIONS

1,2-Dimethyl- Acridine naphthalene 1,6-Dimethyl- Anthracene naphthalene 1-Methyl-9H- Anthraquinone fluorene 1-Methyl- Benz[ a ] phenanthrene anthracene 1-Methylpyrene Benzo[ a ] pyrene 2,2-Biquinoline Benzo[ b ]fluor- anthene 2,3,6-Trimethyl- Benzo[ ghi ] naphthalene perylene 2,6-Dimethyl- Benzo[ k ]fluor- naphthalene anthene 2-Ethylnaphtha- Butylbenzyl- lene phthalate 2-Methylan- Chrysene thracene 3,5-Dimethyl- Di- n -butyl- phenol phthalate 4,5-Methylene- Di- n -octyl- phenanthrene phthalate 4-Chloro-3- Dibenz[ a,h ] methylphenol anthracene 9H-Carbazole Dibenzo- thiophene 9H-Fluorene Diethylphthalate Acenaphthene Dimethyl- phthalate Acenaphthylene Fluoranthene

Anthracene Anthraquinone Benz[ a ] anthracene Benzo[ a ] pyrene Benzo[ b ]fluor- anthene Benzo[ ghi ] perylene Benzo[ k ]fluor- anthene Butylbenzyl- phthalate Chrysene Di- n -butyl- phthalate Di- n -octyl- phthalate Dibenz[ a,h ] anthracene Dibenzo- thiophene Diethylphthalate Dimethyl- phthalate Fluoranthene
U.S. Geological Survey Circular 1169
SUMMARY OF COMPOUND DETECTIONS AND CONCENTRATIONS

Chromium

Indeno[1,2,3- Arsenic cd ]pyrene Isoquinoline Cadmium Naphthalene Chromium N-Nitroso- Copper diphenylamine Phenanthrene Lead Phenanthridine Mercury Phenol Nickel Pyrene Selenium Quinoline Zinc bis(2-Ethyl- hexyl)phthalate p-Cresol

total-Chlordane
Water Quality in the Red River of the North Basin, Minnesota, North Dakota, and South Dakota 1992-95
SUMMARY OF COMPOUND DETECTIONS AND CONCENTRATIONS
Trace elements Organochlorine compounds
U.S. Geological Survey Circular 1169
REFERENCES This Report was Based on the Following Publications
Water Quality in the Red River of the North Basin, Minnesota, North Dakota, and South Dakota, 1992–95
REFERENCES This Report was Based on the Following Publications
U.S. Geological Survey Circular 1169
GLOSSARY
Water Quality in the Red River of the North Basin, Minnesota, North Dakota, and South Dakota, 1992–95
GLOSSARY
U.S. Geological Survey Circular 1169

Stoner and others • Water Quality in the Red River of the North

USGS Circular 1169 • 1998
Where this page came from
This page was imported from U.S. Geological Survey. Published by the U.S. Geological Survey and, as a work of the United States government, in the public domain.
Nobody has written it yet — it is the source material at a new address, which is why search engines are asked to skip it and why no one earns from it. It is up for grabs: take it on, and it is yours to rewrite and to earn from.
Licens: CC0 1.0 (allmän egendom) · Bearbetat efter pubs.usgs.gov
1
0
0
0

Kommentarer