Download Image Download Image of the aftermath of Hurricane Irma
This data visualization shows the maximum wind gusts from Hurricane Irma from September 7 to September 10, 2017. Note how the strongest wind gusts are on the north side of the storm track (the faint dotted line). According to the NOAA's National Hurricane Center, Irma's maximum sustained winds ranged from 110 (on 9/10) to near 180 (on 9/7) miles per hour during this period. This graphic was created with data from the RTMA, which uses surface observation data to create a highly accurate gridded analysis of past weather conditions. The data covers only the Continental United States and coastal areas, so areas of the storm further to the south and east, where Irma was at maximum intensity, are not visible
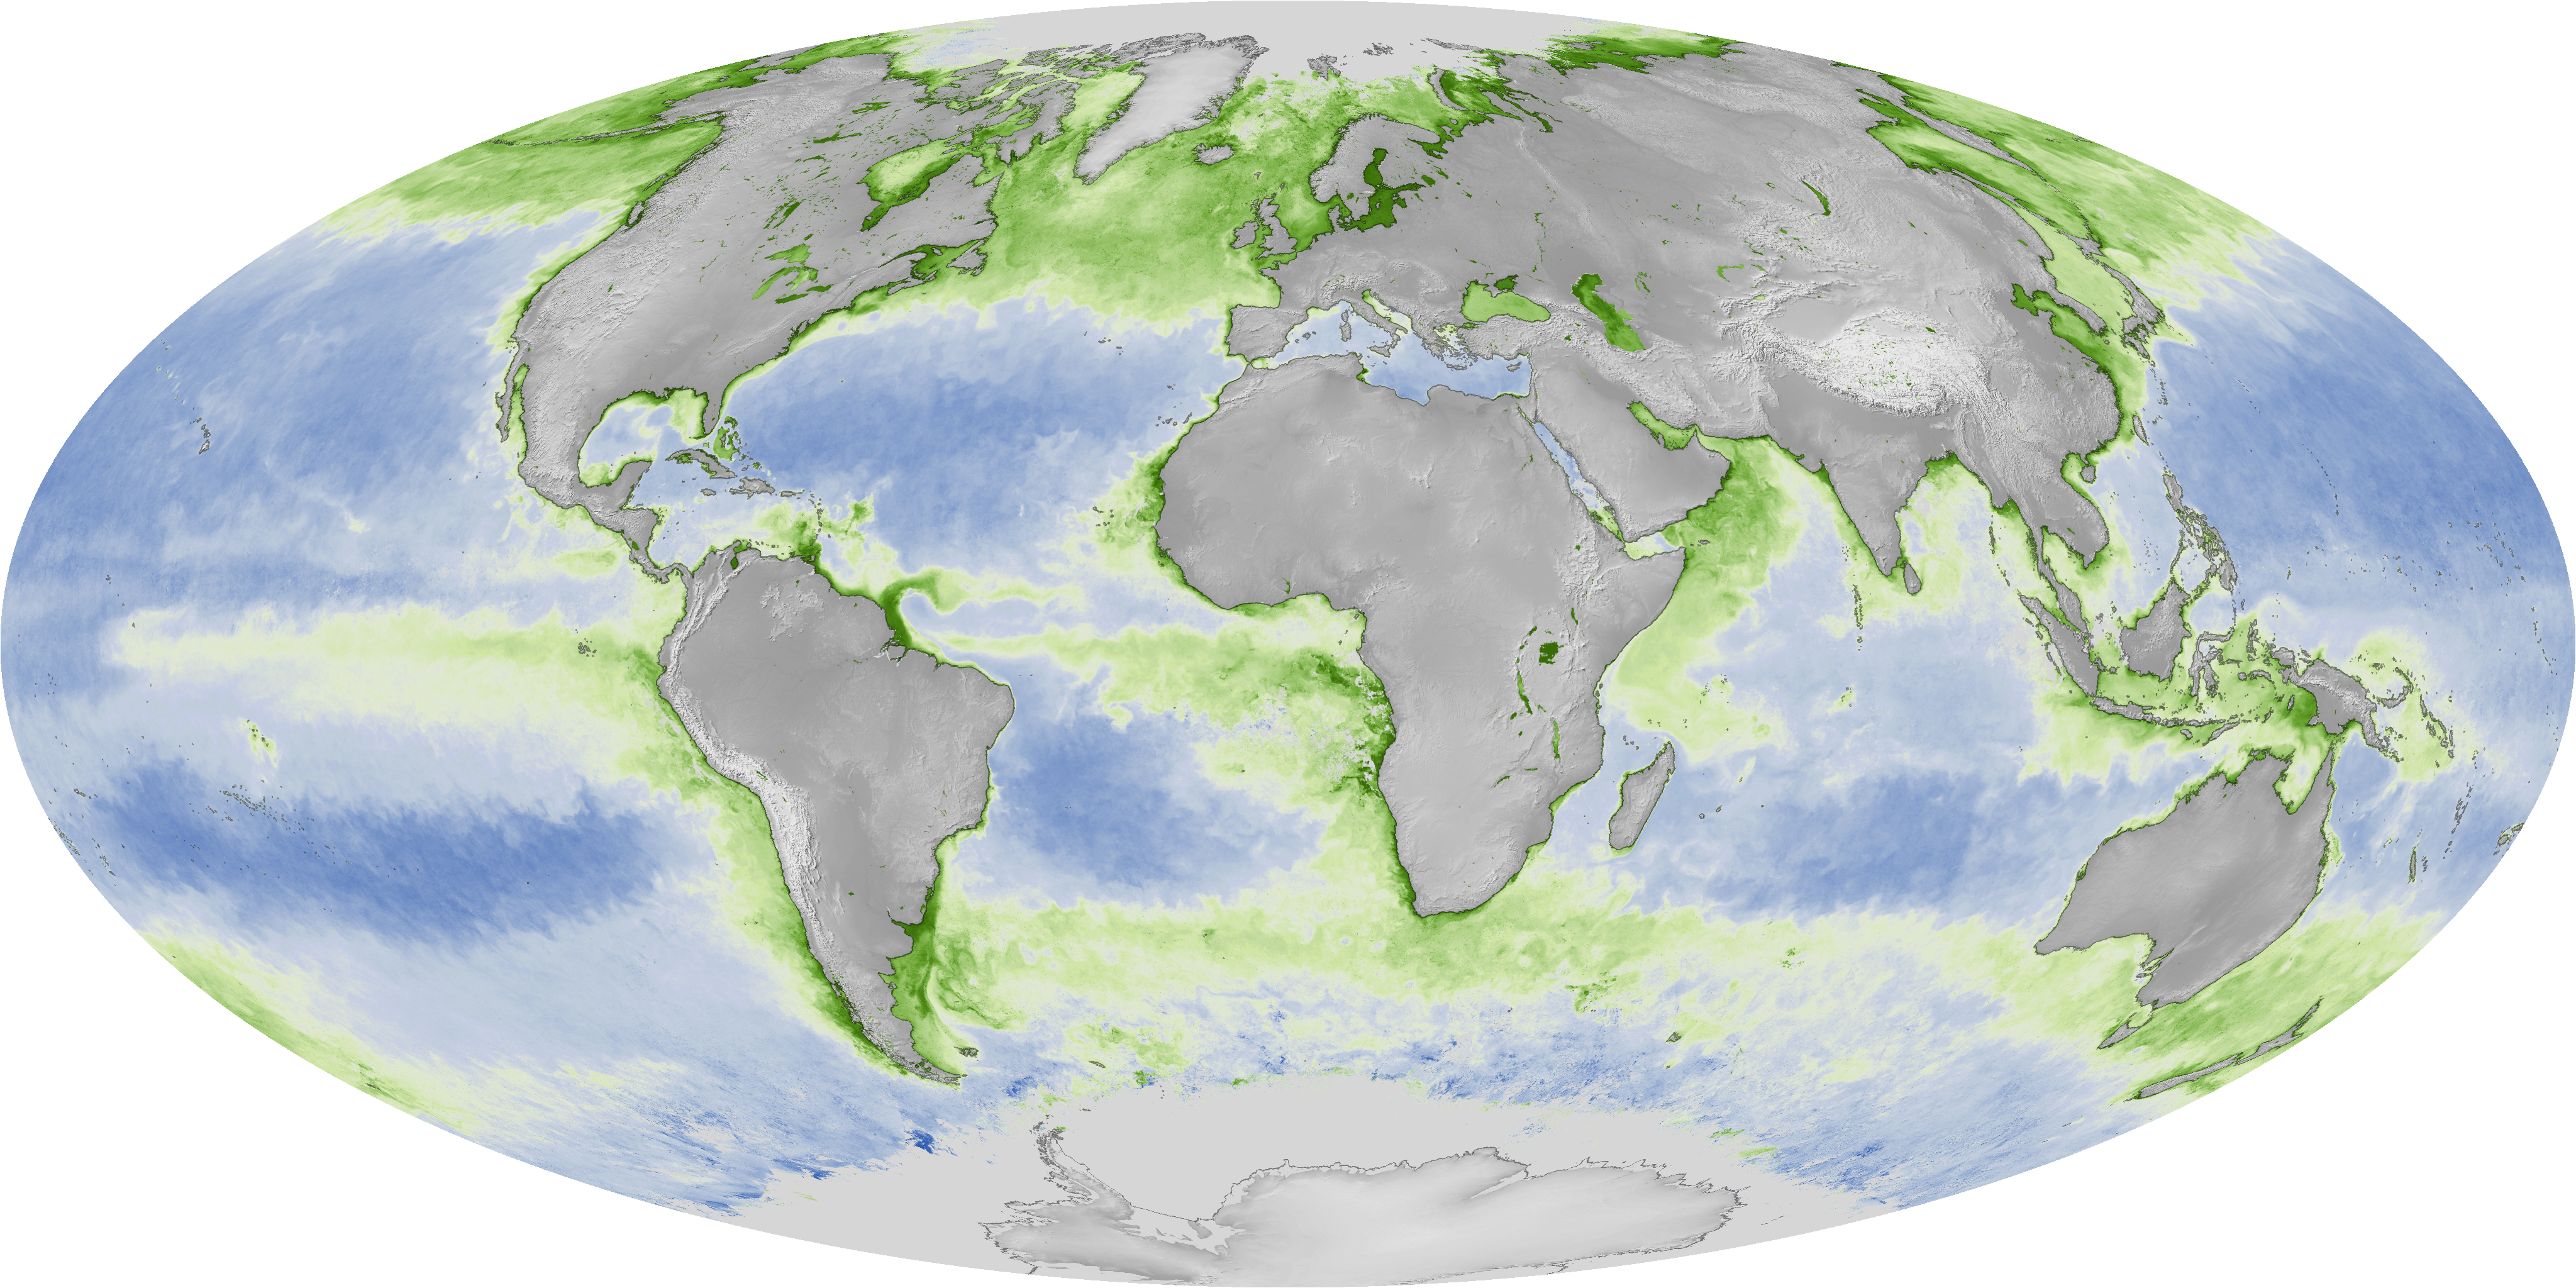
Microscopic phytoplankton are the basis of the world’s marine ecosystems, and since most species contain chlorophyll, which reflects green light back into space, The VIIRS sensor onboard JPSS satellites can detect their presence of phytoplankton in waters around the globe. In this map, the green areas indicate high concentrations of chlorophyll, which are usually constrained to coastal regions or areas in which circulation provides adequate nutrients to support photosynthesis.
This data visualization shows the maximum wind gusts from Hurricane Irma from September 7 to September 10, 2017. Note how the strongest wind gusts are on the north side of the storm track (the faint dotted line). According to the NOAA's National Hurricane Center, Irma's maximum sustained winds ranged from 110 (on 9/10) to near 180 (on 9/7) miles per hour during this period. This graphic was created with data from the RTMA, which uses surface observation data to create a highly accurate gridded analysis of past weather conditions. The data covers only the Continental United States and coastal areas, so areas of the storm further to the south and east, where Irma was at maximum intensity, are not visible
Where this page came from
This page was imported from NOAA Satellites (NESDIS). Published by NOAA's National Environmental Satellite, Data, and Information Service and, as a work of the United States government, in the public domain; pictures credited elsewhere are left out.
Nobody has written it yet — it is the source material at a new address, which is why search engines are asked to skip it and why no one earns from it. It is up for grabs: take it on, and it is yours to rewrite and to earn from.
许可协议: CC0 1.0(公有领域) · 改编自 www.nesdis.noaa.gov
1
0
0
0

留言