
Missouri gets ice storms, severe thunderstorms, tornadoes and floods, and since 1990 it has had 40 federal major disaster declarations. Its southeast corner sits on the New Madrid seismic zone, where three earthquakes estimated at magnitude 7.5 or larger struck in the winter of 1811–1812. It farms on a huge scale and mines a great deal of lead. All of that is easier to manage with a precise 3D map of the ground — which is what the U.S. Geological Survey's 3D Elevation Program (3DEP) is building with laser scanning, or lidar.
The program
3DEP is run by the USGS with federal, state, Tribal, territorial and local partners, and aims to cover the whole country with consistent, high-resolution elevation data for the first time: bare-earth elevation models and 3D point clouds from lidar (radar in Alaska). Buying data for large areas at once saves money, gives partners predictable funding to plan around, and produces coverage that does not stop at county or watershed lines. Nationally, the benefits are conservatively put at $690 million a year, with the potential for $13 billion a year more (Dewberry, 2012).
The baseline standard is quality level 2 or better:
| Quality level | Vertical accuracy (RMSEz) | Pulse spacing | Pulse density |
|---|---|---|---|
| QL0 (best) | ≤ 5 cm | ≤ 0.35 m | ≥ 8 per m² |
| QL1 | ≤ 10 cm | ≤ 0.35 m | ≥ 8 per m² |
| QL2 | ≤ 10 cm | ≤ 0.71 m | ≥ 2 per m² |
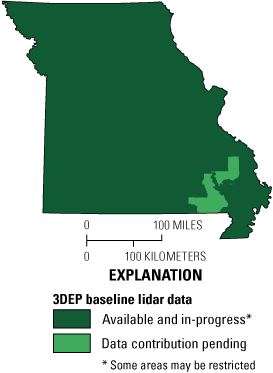
3DEP lidar in Missouri, May 2023: available or in progress everywhere except two small areas in the southeast. Data can be downloaded from the USGS Lidar Explorer.
In Missouri, the Department of Conservation needs quality-level-1 data and the Missouri Geological Survey quality level 2; both began collecting in 2022.
What it is worth to Missouri
| Expected benefits | $11.35 million a year |
| Estimated cost to finish QL2 coverage | $1.99 million (QL0 and QL1 cost more) |
| Payback | 0.18 year — about two months |
| Rank | Use | Annual benefit |
|---|---|---|
| 1 | Agriculture and precision farming | $3.30 million |
| 2 | Natural resources conservation | $2.84 million |
| 3 | Flood risk management | $2.25 million |
| 4 | Homeland security, law enforcement and disaster response | $1.25 million |
| 5 | Infrastructure and construction management | $0.60 million |
| 6 | Water supply and quality | $0.38 million |
| 7 | Forest resources management | $0.20 million |
| 8 | Urban and regional planning | $0.20 million |
| 9 | Geologic resource assessment and hazard mitigation | $0.13 million |
| 10 | Aviation navigation and safety | $0.11 million |
| Other | $0.09 million |
Conservative estimates from the National Enhanced Elevation Assessment (Dewberry, 2012).
Farming
Agribusiness brought Missouri $82.6 billion in 2021, from soybeans, cattle, corn, hogs, poultry, dairy, cotton and rice. A precise terrain model sharpens precision farming: better yields, less soil loss and less chemical runoff, and more return on what farmers spend. Flood mapping matters to farmers too, because floods hit farmland hard.
Floods
Missouri's 2018 hazard mitigation plan leaned on pulling in as much geospatial data as possible. Lidar feeds flood-plain models that produce inundation maps — showing how far a flood will spread and how deep the water will be.

Downtown St. Louis from a lidar point cloud, colored by height above the ground. Graphic by David Nail, USGS
Earthquakes
The flat Bootheel in the far southeast overlies the New Madrid zone, which also reaches into Arkansas, Illinois, Kentucky and Tennessee. Its loose sediments and high water table amplify shaking, making it the highest-risk part of the state. The river valleys of the Mississippi and Missouri do the same, putting much of metropolitan St. Louis at high risk, and past earthquakes in eastern Kansas and Nebraska mean the west of the state is not safe either. In the words of the Missouri Seismic Safety Commission, "No area of Missouri is immune from the danger of earthquakes." Lidar helps map hazards, pick out geologic features and track movement of the ground surface.
Sources
Written from The 3D Elevation Program — Supporting Missouri's Economy, a U.S. Geological Survey fact sheet; a work of the United States government in the public domain. It cites the Missouri State Emergency Management Agency (2018, 2022), the Missouri Seismic Safety Commission (2007), the Missouri Agricultural and Small Business Development Authority (2021) and Dewberry (2012).
许可协议: CC0 1.0(公有领域) · 改编自 pubs.usgs.gov
1
0
0
0

留言


